


Summary of The Beginner's Trading Guide to Fibonacci Cycles Theory
Written by NonyaXBT
This beginner-friendly guide introduces day trading through a structured, plan-based approach. It builds foundational technical analysis skills before focusing on Fibonacci Cycles Theory as a practical tool for identifying high-probability entries, exits, support/resistance, and market cycles. The emphasis is on discipline, risk management, confluence of tools, and psychology stressing that no strategy guarantees wins and traders must commit to at least 100 trades with patience.

Chapter 1: Trading Plan (and 1.1: Setting Up a Trading Plan)
master trading plan is essential—most failures stem from lacking one. Market movement represents risk, not opportunity. No strategy ensures profitability on the next trade (or next 10). Key plan components include:
Bias (bullish/bearish/neutral) Timeframe (higher-timeframe HTF for reliability vs. lower-timeframe LTF for caution) Market structure (MSS/MSB) Trading range (internal/external) Leverage & risk management Probability/win ratio Buy/sell entry triggers Take-profit (TP) & stop-loss (SL)/invalidation Mindset when entering/exiting
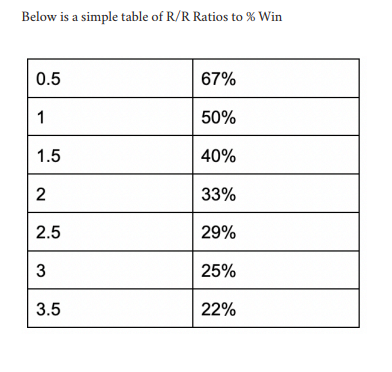
Markets move algorithmically from inefficient to efficient states via human order flow. Setups require all prerequisites met. Assess every setup rigorously (avoid forcing bad trades). Always define risk first (SL placement and impact), then apply a personal minimum risk-to-reward (R/R) ratio. Formula for minimum win rate:
$$\frac{1}{(1+R)} \times 100 = \% \{ of Win Rate}$$
Example: 1:3 R/R needs only 25% win rate to break even. A simple R/R-to-win-rate table is provided (e.g., 1:2 = 33%, 1:3 = 25%).
Entry occurs only when personal risk guidelines are met (position size, % of account risked). Exit can be full close or scaled (e.g., dollar-cost averaging). Post-trade evaluation focuses on process adherence, not P&L keep the system simple and consistent.
Chapter 2: Basics of Day Trading
Day trading leverages capital for quick profits but carries high risk from rapid swings. Core concepts covered:
- Market trends & ranges (Ch. 2.1)
- Market structure (MSB) (Ch. 2.2)
- Supply & demand (Ch. 2.3)
- Support & resistance (Ch. 2.4)
- Moving averages (Ch. 2.5)
- RSI (Ch. 2.6)
- MACD (Ch. 2.7)
- Using Fibonacci in day trading (Ch. 2.8 – the core of the book)
- [ ]
Key Technical Foundations
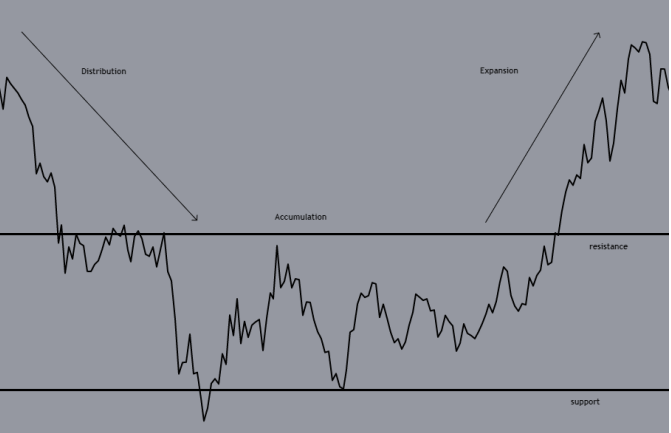
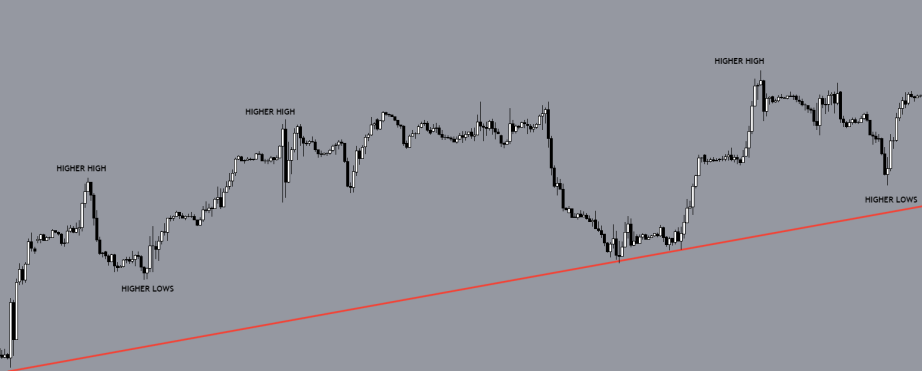
- Trends: Bullish (higher highs/higher lows), bearish (lower highs/lower lows), sideways (accumulation/distribution). HTF trends are more reliable. Markets cycle: Accumulation → Distribution → Manipulation (sometimes) → Expansion (trend).
- Wyckoff principles: Trading ranges show equilibrium; accumulation/distribution by institutions precedes breakouts. Laws of supply/demand, cause/effect, effort vs. result.
- Market Structure (MSB): Series of peaks/valleys (fractal across timeframes). Bullish = HH/HL (break prior high confirms); bearish = LH/LL. Breaks confirmed by trend-line violation, rejections, or series of HH/HL or LH/LL + volume/momentum.
- Supply & Demand Zones: Created by large funds splitting massive orders to avoid slippage. Demand zones (support) = areas of heavy buying (draw rectangle from swing low to last small candle before surge). Supply zones (resistance) = heavy selling (similar method). Price oscillates between them; trade reversals here for excellent R/R. SC Ultra TradingView tool automates detection.
- Support & Resistance: Horizontal swing-point levels. Support absorbs selling; resistance absorbs buying. Draw major daily levels (not obsessed with every minor one). Use for entries/exits; combine with other tools. Levels can flip roles in trends.
- Moving Averages: Lagging trend filters. Common setups: 13/21 SMA (short-term daily), 200 EMA (long-term); golden cross (50 SMA > 200 EMA), death cross (opposite). 8 EMA (4H) ≈ 34 SMA (1H). Double-crossover method (e.g., 8/21 or 13/34) reduces whipsaws. Fibonacci numbers (13, 21, 34, 55) work exceptionally well as MAs on daily/weekly charts. SMA (equal weight) vs. EMA (recent data weighted more).
- RSI (Relative Strength Index): 0–100 scale; >70 overbought, <30 oversold. Formula
$RSI = 100 - \frac{100}{1 + RS}, \quad RS_t = \frac{\{Average Gain}_t}{\text{Average Loss}_t}$
- Use for oversold bounces or divergences (price makes new high/low but RSI does not → reversal warning). Lagging indicator.
- MACD: Used for trend confirmation via crossovers (mentioned in later examples with Fib).
Chapter 2.8: Using Fibonacci in Day Trading (Core Theory)
Fibonacci numbers/ratios (named after Leonardo Fibonacci) appear throughout nature and markets, following the same mathematical rules. Key ratio: golden ratio ≈ 1.618 (and reciprocals like 0.618). Tools:
- Retracement levels (most common): 0.236, 0.382, 0.5, 0.618, 0.786 – act as dynamic support/resistance.
- Extensions (1.272, 1.618, etc.) for profit targets.
- Arcs and time targets
Specific Fibonacci Cycles Setups (high-probability with confluence):
- 0.618–0.236 Retracement (after market structure break in trend):
- Draw Fib from swing low to high (or vice versa).
- Enter on rejection at 0.618 (or sweep of 0.236 low).
- TP follows sequence (often to next Fib level or 1.618 extension).
- Rules: Use on trending assets post-MSB; combine with supply/demand.
0.618–0.236 Extension (post-rally MSB): Targets old highs or 1.618 levels.
- Fibonacci Time Targets: Project future turning points on Fib-numbered days (13, 21, 34, 55, 89, etc.) from major tops/bottoms. Least emphasized but useful on daily charts.
- Golden Spiral / Cycles: Markets operate in cyclical, predictable patterns mirroring natural phenomena. Integrate with S/D zones, MACD/RSI crossovers, and MAs for confluence.
- Trading Rules for Fibonacci:
Master basics first.
- Use multiple timeframes.
- Clear entry/exit, stop-loss always.
- No revenge trading.
- Seek actual high-probability setups only.
- Examples show combining Fib with demand zones + MACD for trend reversals and precise TPs.
Chapter 3: Putting It All Together + Trading Styles
Combines all tools into practical strategies:
- 3.1 Scalping (NOT for beginners – fast, high-frequency).
- 3.2 Swing Trading (beginner-friendly – holds hours to days).
- 3.3 Position Trading (beginner-recommended – longer holds, lower stress).
Emphasizes confluence (structure + S/D + Fib + indicators) and higher-timeframe bias.
Later Chapters (4–9)
- Order Types: Market, limit, stop-loss, etc.
- Risk Management (Ch. 5): Position sizing, R/R, capital preservation – non-negotiable.
- Leverage (Ch. 6): Powerful but dangerous in crypto; use cautiously.
- Psychology in Day Trading (Ch. 7): Discipline, emotional control, patience.
- Trading Rules (Ch. 8): Detailed checklist – map S/R & valid S/D zones, Fib liquidity pools, confirm bias with MACD/RSI/MAs, watch session times (NY open/Asia close), premium/discount areas, fractal nature of markets.
- Conclusion (Ch. 9): Reinforces that Fibonacci Cycles Theory, when combined with fundamentals (supply/demand, structure, indicators) and strict risk/psychology rules, provides a repeatable edge in crypto day trading.
READ THE FULL BOOK FOR FREE IN THE LINK BELOW