

ResearchLab
Explore our research papers, strategies, books, and market insights from TA Quant's research team.

In The
News

TAQUANT Surpasses $500M in Monthly Trading Volume
TAQUANT's algorithmic trading platform has crossed the $500 million monthly trading volume milestone, driven by growing adoption of its automated strategy marketplace and institutional API.
Read MoreResearch
Research Papers
TAQUANT WHITEPAPER
# TA QUANT **TECHNICAL WHITEPAPER** **Institutional-Grade Crypto Trading Infrastructure** **Execution - Intelligence - Attribution - Automation** **March 2026** <10ms 99.94% 900+ OPS 5 Agent Classes **Execution Latency** **Uptime (Beta)** **Rust Orders/sec** **AI Taxonomy Depth** [taquant.com](https://taquant.com) ## Abstract This whitepaper describes the complete technical architecture of the TA Quant platform. It is intended for technical readers - engineers, quantitative researchers, and technology leaders at trading firms, exchanges, and institutional counterparties - who require a detailed understanding of how the platform is designed, what guarantees it provides, and how its components interact. TA Quant is a four-layer, closed-loop trading infrastructure platform. The Execution Layer (Terminal) provides deterministic, multi-exchange order lifecycle management built in native Rust. The Intelligence Layer (TA Quant AI) is a coordinated multi-agent system that replicates the functional architecture of an institutional quantitative trading desk. The Distribution Layer (TA Syndicate) is a performance-attributed marketing and KOL management infrastructure with verifiable full-funnel attribution from campaign exposure to executed on-exchange volume. A dedicated AI Strategy Agent (AISA) provides fully autonomous, policy-constrained trade execution for users who require a hands-off trading experience. The platform is engineered around five non-negotiable architectural principles: separation of concerns across all layers, deterministic behaviour at the execution level, ensemble strategy management at the intelligence level, fraud-resistant attribution at the distribution level, and continuous closed-loop learning between all components. These principles are enforced architecturally - not by convention. Performance data from the 90-day beta: 99.94% system uptime, sub-10ms internal routing latency, 4.2 basis points average slippage on liquid perpetual pairs, and measurable AI learning convergence across execution heuristics. All figures are from live system operation. ## Part I: System Philosophy & Architectural Principles ### 1.1 The Integration Thesis The fundamental technical insight underlying TA Quant's architecture is that execution quality, trading intelligence, and growth attribution are not independent problems. They are the same problem expressed at different system layers. Every platform that treats them independently creates integration seams that degrade performance, introduce latency, and prevent the data feedback loops that produce compounding system improvement. TA Quant is designed as a single integrated system with interconnected layers that share data infrastructure, authentication state, and execution context. The absence of integration seams is not a user experience decision - it is a technical requirement for the feedback loops that make the system improve continuously with use. ### 1.2 Five Core Architectural Principles **Separation of Concerns at Layer Boundaries** Each system layer has a precisely defined domain and is prevented from crossing its boundaries. The execution engine has no opinion on what to trade, only how to trade it. Alpha agents generate signals but cannot submit orders. Risk agents can veto all upstream decisions but cannot modify strategy logic. Attribution infrastructure consumes execution data but cannot influence execution decisions. These constraints are enforced programmatically at the component boundary level. **Determinism at the Execution Layer** The execution engine behaves identically under all market conditions - normal trading, high volatility, exchange degradation, and partial connectivity. No probabilistic logic is introduced at the execution layer. Probabilistic decisions such as signal generation, venue scoring, and regime classification occur upstream. By the time any decision reaches the execution engine, it has been reduced to a deterministic instruction set. This prevents the class of failures where execution systems behave unexpectedly during market stress - precisely the conditions where reliability matters most. **Ensemble Architecture at the Intelligence Layer** No single model, strategy, or agent is relied upon for system performance. The AI layer is structured as a coordinated ensemble where multiple specialised agents operate in parallel over shared market state. Capital is dynamically allocated across strategy ensembles. Poorly performing components are de-weighted or disabled without disrupting the overall system. This mirrors institutional portfolio construction and ensures the platform survives the strategy degradation cycles that are inevitable in live markets. **Verifiable Attribution Throughout** Every attribution claim the platform makes - from execution metadata to campaign conversion - is programmatically verifiable and auditable. The Syndicate attribution chain is deterministic: a campaign exposure either did or did not produce an attributed trade, and this determination is made by the execution layer, not by self-reporting from KOLs or third-party tracking pixels. This level of rigour is only possible because the platform controls both the attribution source (the campaign) and the attribution anchor (the execution layer). **Continuous Closed-Loop Learning** Every layer generates feedback signals consumed by every other layer. Execution quality data updates AI execution heuristics. Strategy performance updates capital allocation weights. Campaign attribution data updates user acquisition models. The system improves as a function of operating - through structured, supervised adaptation bounded by deterministic safety constraints. ### 1.3 Four-Layer Architecture Overview | Layer | Component | Primary Function | Output | |----------------|------------------------|-------------------------------------------------------|---------------------------------------------| | Execution | Terminal (Rust) | Multi-exchange order lifecycle management | Executed trades + execution metadata | | Intelligence | TA Quant AI (Multi-Agent) | Regime detection, alpha generation, risk control, portfolio orchestration | Trading signals + risk decisions | | Distribution | TA Syndicate | Verified KOL campaigns, fraud-resistant attribution, full-funnel tracking | Attributed volume + user acquisition | | Automation | AISA (AI Strategy Agent) | Autonomous policy-constrained trade execution | Hands-off trading with full audit trail | ## Part II: Terminal - Execution Infrastructure ### 2.1 Execution Engine Design Philosophy The Terminal execution engine is implemented in native Rust. This is not a performance optimisation applied to a system designed in another language - Rust is the foundational design decision from which all other execution layer properties follow. Memory safety without garbage collection, zero-cost abstractions, and ownership semantics deliver microsecond-level order book processing with the deterministic memory behaviour required for consistent low-latency execution under load. **EXECUTION ENGINE PERFORMANCE - 90-DAY BETA** - **Internal routing latency**: sub-10ms under all measured load conditions - **Order throughput**: 900+ orders per second on standard cloud infrastructure - **Average slippage (BTC/USDT perpetual, liquid conditions)**: 4.2 basis points - **Limit order fill rate within spread**: 99.7% under normal market conditions - **System uptime**: 99.94% - two planned maintenance windows, zero unplanned outages - **Memory footprint**: approximately 140MB under full production load ### 2.2 Core Component Architecture **API Gateway Layer** Manages all external communications: user authentication with MFA enforcement, rate limiting, request routing, and TLS 1.3 termination. The gateway is stateless, enabling horizontal scaling without session affinity constraints. **Exchange Connector Service** Maintains persistent connections to 50+ exchanges through independent, sandboxed adapter modules. Each adapter is fully isolated - failure of one adapter cannot cascade to others. Each adapter handles exchange-specific authentication, WebSocket connection management with automatic reconnection and sequence number validation, real-time order book normalisation to the platform's canonical data model, and adaptive rate limit management with circuit breaker logic. **Order Management System (OMS)** The OMS is the central source of truth for order state across all connected exchanges. It maintains the full lifecycle state of every order from pre-submission validation through final reconciliation and provides the complete audit trail required by institutional clients. - Idempotent order submission - duplicate submissions during network recovery are detected and deduplicated, preventing double-fills - Sequence guarantees - causal ordering of order state transitions is enforced; an order cannot skip states - Persistent state - OMS state is written to durable storage before any execution-side action, enabling consistent recovery from any failure - Partial fill handling - partial fills are first-class events; position state updates atomically with each fill report **Market Data Engine** Aggregates and normalises market data across all connected exchanges into a unified, nanosecond-timestamped canonical representation. Maintains full-depth L2 order books in memory for all subscribed instruments, with outlier detection, gap filling, and automatic failover to secondary feeds on primary degradation. Historical data covers 500+ instruments spanning 5+ years. **Smart Routing Engine** Translates venue-agnostic trade instructions from the AI layer into exchange-specific submission decisions. Routing is computed fresh for every order and every slice of a worked order, evaluating four dimensions simultaneously: order book depth and spread, fee and rebate structure, exchange latency profile, and historical fill probability from an ML model trained on live execution data. ### 2.3 Order Lifecycle - Seven Stages Every order passes through a seven-stage lifecycle without exception. No stage can be bypassed. All transitions are logged with nanosecond timestamps to the immutable audit trail. | # | Stage | Detail | |---|--------------------------|------------------------------------------------------------------------| | 1 | Pre-trade validation | Schema validation, account state, instrument tradability, exchange maintenance window check | | 2 | Risk & exposure checks | Position sizing, drawdown check, correlation-aware exposure cap, kill-switch state | | 3 | Venue selection | Smart routing engine scores available venues; decision logged with full scoring breakdown | | 4 | Order type optimisation | Order type selected based on urgency, spread, depth, and maker/taker preference | | 5 | Submission & acknowledgement | Order submitted; idempotency key attached; acknowledgement captured and validated | | 6 | Fill handling | Each fill triggers atomic position update; remaining quantity re-routed if partial | | 7 | Post-trade reconciliation | Execution metadata captured and published to the AI feedback pipeline for continuous learning | ### 2.4 Advanced Order Types | Order Type | Implementation | |---------------------|----------------| | TWAP | Divides total quantity into equal time-slices with randomised timing jitter (+/-15% default) to reduce predictability; auto-pauses when spread or depth conditions deteriorate beyond configurable thresholds | | VWAP | Executes in proportion to historical and live volume patterns; pacing adjusts in real time as observed volume deviates from the historical profile | | Iceberg | Displays only a configurable fraction of total size; the visible portion refreshes immediately on fill; refresh quantities are randomised to avoid detection patterns | | Basket Orders | Executes multiple correlated instruments as a single coordinated operation; computes a submission schedule minimising aggregate market impact; conditional cancellation if any leg fails beyond threshold | | Conditional / Multi-Trigger | Executes when one or more simultaneous conditions are met - price threshold, technical indicator value, cross-market condition, or time window; conditions evaluated at tick frequency | ### 2.5 Portfolio Management & Risk Analytics Positions are maintained in-memory with O(1) lookup and atomic update semantics, providing a real-time, consistent view of portfolio state across all connected exchanges. Risk metrics are computed continuously: | Metric | Description | |---------------------------|-------------| | Value at Risk (VaR) | Historical simulation at 95% and 99% confidence; recomputed on every position change | | Portfolio Greeks | Delta, gamma, vega, theta for derivatives positions; aggregated across all active instruments | | Correlation Matrix | Rolling 30/60/90-day correlation matrices; used by risk agents for exposure cap enforcement | | Margin Utilisation | Per-exchange margin tracked in real time with configurable alert thresholds | | Drawdown Monitoring | Peak-to-trough drawdown at strategy, portfolio, and account levels with automated intervention triggers | | Concentration Risk | Position concentration by asset and strategy measured using Herfindahl-Hirschman Index | ### 2.6 FIX Protocol & API Access The Terminal provides FIX 4.4 and FIX 5.0 connectivity for institutional clients requiring deterministic throughput and integration with existing order management systems. FIX sessions access the same underlying OMS and smart routing engine as REST and WebSocket users - FIX is a transport layer, not a separate execution path. This ensures consistent execution behaviour across all access methods. | Access Method | Protocol | Use Cases | |-------------------|-------------------|-----------| | REST API | HTTPS / JSON | Account management, order submission, portfolio query, historical data | | WebSocket Streams | WSS | Real-time market data, order status, position updates, alert delivery | | FIX Protocol | FIX 4.4 / 5.0 | Institutional order entry, execution reports, market data subscription | | Python SDK | REST + WebSocket wrapper | Systematic strategy integration, async execution, backtesting data | ## Part III: TA Quant AI - Multi-Agent Intelligence System ### 3.1 System Design Overview TA Quant AI is not a single model, signal generator, or bot. It is a coordinated multi-agent system with specialised agents across five functional classes that map directly to the roles of an institutional quantitative trading desk. The architecture enforces a critical invariant: information flows downstream through agent classes - market state feeds alpha, alpha feeds execution, execution feeds risk, risk feeds portfolio - but authority flows upstream. Risk agents can override alpha agents. Portfolio agents can override strategy allocation. Kill-switches override everything. The orchestration layer manages agent scheduling, shared state access through typed interfaces, the authority hierarchy when conflicting outputs are produced, and a complete decision log for auditing and feedback learning. ### 3.2 Agent Taxonomy - Five Functional Classes #### Class 1: Market State & Regime Agents Market state agents classify the current trading environment and condition all downstream agents. No alpha signal is evaluated without regime conditioning - this is enforced architecturally. | Agent | Function | Output | |------------------------------|----------|--------| | Volatility Regime Detector | Classifies current volatility state using realised vol, implied vol, and historical percentile | Regime label, confidence score, expected duration | | Trend / Range Classifier | Determines directional vs. mean-reverting character via Hurst exponent, ADX, autocorrelation | Regime label, strength score, lookback-adjusted confidence | | Liquidity Analyser | Evaluates order book depth, bid-ask spread, and market impact cost across active venues | Liquidity score per instrument per venue; spread regime label | | Event & Anomaly Detector | Monitors for statistical anomalies on volume, spread, and price velocity; tracks scheduled events | Anomaly flag, severity score, recommended action | | Regime Transition Estimator | Estimates transition probabilities between regimes using a Hidden Markov Model | Transition probability matrix, time-to-expected-transition estimate | #### Class 2: Alpha Research Agents Alpha agents generate candidate trading signals. Each agent produces a structured signal object: directional bias, expected return, risk estimate, confidence score, and recommended time horizon. Signals are proposals - they cannot directly cause order submission. Every signal passes through risk and execution agents before any trade instruction is generated. | Strategy Family | Implementation | Regime Fit | |------------------------------|----------------|------------| | Trend Following & Momentum | Multi-timeframe EMA crossovers, ADX-filtered breakouts, rate-of-change ranking | Active in trending regimes; de-weighted in range-bound conditions | | Mean Reversion | Bollinger Band reversals, RSI divergences, Z-score statistical arbitrage across correlated pairs | Active in range regimes; disabled in high-volatility environments | | Volatility Strategies | ATR-based breakout detection, Bollinger squeeze identification, volatility regime positioning | Active during regime transitions; effective around volatility events | | Cross-Exchange Arbitrage | Real-time price discrepancy monitoring; funding rate carry; spot-perpetual basis trading | Regime-agnostic - driven by market microstructure | | Sentiment & Alternative Data | Social sentiment aggregation, on-chain flow analysis, funding rate extremes | Signal modifier and overlay rather than primary signal source | | ML-Enhanced Prediction | LSTM and transformer models for short-horizon direction; gradient-boosted feature models; RL agents for parameter adaptation | Regime label is a feature input; all predictions are regime-conditioned | #### Class 3: Execution Intelligence Agents Execution intelligence agents translate approved trade instructions into optimised execution parameters. They operate at tick frequency consuming live order book data, venue latency metrics, and historical fill performance. Their outputs are execution specifications that the Terminal routing engine implements. - **Order Type Selection**: evaluates urgency, spread, depth, and maker/taker preference to select the optimal order type - **Venue Selection**: scores available venues using the four-factor routing model and produces a quantity-allocated venue ranking - **Maker/Taker Optimiser**: evaluates whether maker rebate justifies execution risk; updates based on current spread relative to strategy slippage tolerance - **Slippage Estimator**: models expected market impact before submission; adjusts size, timing, and venue allocation to maintain slippage within strategy tolerances - **Execution Feedback Agent**: consumes post-trade metadata and updates execution heuristics - the system's primary learning mechanism #### Class 4: Risk & Exposure Control Agents Risk agents are the system's immune system. They operate in parallel with all other classes and have unconditional veto authority - enforced architecturally, not by convention. A risk agent's block decision cannot be overridden by any other agent or strategy configuration. | Control | Implementation | |--------------------------------|----------------| | Position Sizing | Maximum position size per instrument enforced at every order; breaches block the order and generate an alert | | Correlation-Aware Exposure | Portfolio exposure to correlated clusters capped independently of individual position limits; prevents inadvertent concentration during correlation shifts | | Drawdown Management | Progressive intervention: position sizing reduced at 50% of max drawdown threshold, reduced further at 75%; strategy halted at 100% | | Automated Kill-Switch | Triggers on: account drawdown exceeding limit, anomaly detector at critical severity, exchange adapter failure affecting active positions, or manual operator trigger | | Cross-Strategy Exposure | Total portfolio exposure across all running strategies monitored against account-level limit; strategies throttled proportionally when approaching limit | | Liquidation Risk Monitor | Real-time tracking of distance to liquidation price for leveraged positions; automatic de-leveraging trigger at configurable proximity threshold | #### Class 5: Portfolio Orchestration Agents Portfolio orchestration agents manage capital allocation across the full strategy ensemble. Their objective is to maximise risk-adjusted portfolio returns while maintaining return stability - not to maximise any individual strategy. - **Strategy Weighting Agent**: allocates capital using recent Sharpe ratio, volatility contribution, and regime fit score; recalculated daily and after significant portfolio events - **Capital Rebalancing Agent**: identifies allocation drift from differential strategy performance and initiates rebalancing orders; threshold-triggered to avoid excessive transaction costs - **Regime-Conditioned Allocation**: adjusts strategy family weights based on regime classification - trending regimes increase momentum weight, range regimes increase mean-reversion weight; bounded so no strategy family can be zeroed out by regime conditioning alone - **Ensemble Correlation Monitor**: tracks realised correlation between strategy returns; elevated correlation triggers review and potential portfolio exposure reduction ### 3.3 Learning & Feedback Loop Architecture The AI system learns continuously from live execution outcomes. Learning operates on a streaming basis from the execution feedback pipeline - not as a batch process. All learning occurs within predefined parameter spaces and cannot modify core risk controls, increase agent authority, or make structural changes to the agent hierarchy. | Feedback Signal | Consuming Agent | Update Mechanism | |----------------------------------|----------------------------|------------------| | Post-trade slippage vs. estimate | Slippage Estimator | Updates venue-specific slippage model coefficients via gradient descent on prediction error | | Fill rate per venue per order type | Venue Selection Agent | Updates fill probability estimates in the routing scoring function | | Strategy P&L vs. forecast | Portfolio Weighting Agent | Updates alpha confidence scores; outperforming strategies receive higher allocation weight | | Regime prediction vs. realised | Regime Transition Estimator| Updates HMM transition probability matrix from observed regime sequences | | Agent trust scores | Orchestration Layer | Systematically underperforming agents flagged for review; weight in ensemble decisions reduced | ### 3.4 Backtesting Engine The backtesting engine runs against a historical data store covering 500+ instruments at minute-level OHLCV resolution spanning 5+ years, supplemented by tick-level trade data, order book snapshots, funding rates, on-chain metrics, and sentiment indices. - **Vectorised Backtesting**: fast signal-to-return computation for strategy screening and parameter search - **Event-Driven Backtesting**: order-by-order simulation running through the same strategy and risk agent logic that governs live trading - the required methodology for strategies with complex order management - **Monte Carlo Simulation**: generates probability distributions over outcomes across diverse market scenarios for stress-testing and forward-looking performance estimation Execution modelling is realistic: slippage calibrated from live execution data, simulated execution delay, square-root market impact for large orders, realistic partial fill and rejection rates, and funding and borrow costs for leveraged positions. ### 3.5 Strategy Marketplace The strategy marketplace allows external quantitative developers to contribute strategies to the platform. Contributed strategies run in an isolated execution sandbox with no access to account credentials, no direct order submission capability, and no access to other users' position data. Quality gates for marketplace listing: - Minimum 3-year backtest with realistic execution modelling and out-of-sample walk-forward validation - Sharpe ratio of at least 0.8 out-of-sample annualised; maximum drawdown not exceeding 25% - Minimum 90-day paper trading period with performance within 20% of backtest expectation - Code review by the platform quantitative team for look-ahead bias, survivorship bias, and implementation correctness - 30-day limited live deployment at reduced capital before full marketplace availability ## Part IV: AISA - AI Strategy Agent AISA (AI Strategy Agent) is a fully autonomous, capital-executing trading agent that operates under a user-defined policy framework. It is distinct from the TA Quant AI multi-agent research system - where the AI system generates recommendations, AISA acts on them directly, placing orders through the Terminal OMS under the constraints of the user's configured policy. ### 4.1 Distinction from the AI Research System | Dimension | TA Quant AI | AISA | |--------------------|--------------------------------------------------|------| | Primary function | Research, analysis, signal generation, portfolio optimisation recommendations | Autonomous execution - places orders directly under policy constraints | | Capital control | Advisory - outputs are proposals for human or strategy review | Executing - submits live orders through the Terminal OMS | | User interaction | Configure agents, review signals, set allocation parameters | Configure policy, monitor performance, review event log | | Override mechanism | Human or risk agent | User-defined policy; automatic halt on policy breach | ### 4.2 Policy Framework AISA operates under a user-defined trading policy that constrains all autonomous decisions. No AISA action can violate the configured policy - the policy layer has unconditional authority over the agent's execution. Policy parameters include: - Maximum position size per instrument, in absolute terms and as a percentage of account NAV - Maximum total portfolio exposure at any point in time - Instrument whitelist and blacklist - AISA cannot trade outside the permitted universe - Maximum drawdown threshold - AISA self-halts when portfolio drawdown exceeds the configured limit - Trading hours constraints - AISA can be restricted to specific time windows - Minimum signal confidence threshold - only signals exceeding the configured confidence level trigger execution ### 4.3 Event System & Audit Trail AISA maintains a time-ordered event log of all agent decisions, signal evaluations, policy checks, and trade executions. Every AISA action is traceable from its triggering signal through the policy check to the resulting order in the OMS. Events are available in real time through the AISA monitoring interface and retained in full for historical review and compliance reporting. ### 4.4 Trade Attribution AISA-executed trades are tagged in the OMS with the agent identifier and the policy version under which the trade was executed. This attribution enables clean performance analysis that distinguishes AISA-executed trades from manually placed trades and from other strategy-driven trades - providing unambiguous performance attribution at the agent level. ## Part V: TA Syndicate - Attribution Infrastructure ### 5.1 Attribution Architecture TA Syndicate's core technical contribution is a verifiable attribution chain that connects a marketing event to an executed trade on a partner exchange. This chain is deterministic - there is no probabilistic inference. An attributed trade either has a valid, unbroken attribution chain back to its originating campaign event, or it does not count. This level of rigour is only achievable because TA Quant controls both ends of the attribution chain: the campaign origination through the Syndicate platform, and the execution anchor through the Terminal. Platforms that rely on exchange-reported affiliate data without controlling the execution layer cannot achieve this - they are trusting third-party data that is aggregated, delayed, and unauditable. ### 5.2 Four-Layer Attribution Framework **Layer 1: Campaign Event Capture** Every campaign asset carries a unique, cryptographically signed attribution token encoding the campaign ID, KOL ID, asset version, and timestamp with a tamper-preventing signature. When a user interacts with a campaign asset, the token is captured and stored in the attribution event log. **Layer 2: User Journey Tracking** UTM parameter tracking, first-party session continuity, and referral codes maintain attribution as users move from campaign exposure through platform registration, account funding, and first trade. Attribution windows are configurable per campaign. Multi-touch attribution is supported with configurable weighting models including first-touch, last-touch, linear, time-decay, and data-driven approaches. **Layer 3: Exchange Volume Attribution** Terminal-connected accounts are programmatically tagged at registration with their originating attribution token. When a tagged account executes a trade through the Terminal, the trade is attributed to the originating campaign directly from the OMS - not from exchange affiliate reporting APIs. This provides deterministic, real-time attribution data with a complete audit trail. **Layer 4: On-Chain Attribution** For DeFi protocol campaigns, wallet-level tracking provides attribution anchored to the immutable on-chain ledger. Sybil detection filters wallets exhibiting suspicious patterns - same deposit amounts, coordinated timing, or common withdrawal destinations - ensuring that on-chain attribution reflects genuine user activity. ### 5.3 KOL Network Infrastructure **Verification Pipeline** All KOLs pass through an automated verification pipeline before campaign participation: - Audience authenticity analysis: follower growth pattern analysis, engagement rate validation against tier benchmarks, bot detection using proprietary engagement pattern models - Trading account verification: KOLs must connect a live trading account through the Terminal to confirm they are active traders - a differentiating requirement not enforced by competing KOL platforms - Content history review: quality assessment of historical content, previous campaign performance where available, compliance review against platform content standards - Geographic verification: audience demographics verified against claimed geographic focus; significant mismatches result in tier downgrade or rejection **Performance Scoring** Every KOL has a continuously updated performance score computed from: attributed conversion rate from impressions to funded accounts, average trading volume per attributed user, audience retention at 30/60/90 days, and content compliance rate. Scores determine campaign eligibility, compensation rates, and tier classification. ### 5.4 Campaign Management Campaign briefs are structured data objects, not free-form documents. The campaign engine validates each brief against a schema enforcing: objective definition, KOL selection constraints, budget and compensation structure, attribution window, and success metrics. All campaigns are evaluated against executed volume and funded account outcomes - not impressions or follower counts. ### 5.5 Competition Platform The white-label trading competition infrastructure integrates with the Terminal for real-time position tracking and leaderboard computation. Anti-manipulation logic flags positions that offset each other across accounts or that round-trip within implausibly short windows. Automated prize distribution and real-time leaderboards with configurable ranking metrics are included. ### 5.6 Narrative Intelligence Engine An NLP pipeline monitors market narrative formation and provides strategic campaign timing and positioning guidance. Components include real-time sentiment monitoring across social platforms updated at 5-minute intervals, narrative lifecycle tracking from emergence through peak and decay, competitor intelligence on campaign activity and exchange marketing signals, and crisis detection for early warning of reputation threats. ## Part VI: Advanced Automation & Execution Systems Beyond the core Terminal execution and AI intelligence layers, the platform provides four specialised automation subsystems addressing distinct professional trading use cases: exchange algorithmic strategy deployment, market making, high-frequency trading, and general algorithm bot management. ### 6.1 Exchange Algo System The Exchange Algo System is a full strategy deployment and lifecycle management framework for algorithmic strategies that run continuously against live markets. It is distinct from the Terminal's single-order execution algorithms - it is a persistent, managed system that deploys strategies, allocates capital, monitors performance, and provides simulation capability before live deployment. | Capability | Description | |-------------------------|-------------| | Strategy Definition | Define algorithmic strategies with configurable entry/exit conditions, instrument universe, timing parameters, and risk rules | | Capital Allocation | Allocate capital budgets per strategy; track utilisation in real time; rebalance allocations without stopping running strategies | | Simulator | Run strategies against live market data in paper mode before deploying capital; compare simulator vs. live performance to validate strategy behaviour | | Deployment Management | Version-controlled strategy configurations; deployment history; rollback to prior configuration without manual re-entry | | Live Monitoring | Real-time order flow, position state, fill rate, slippage, and latency metrics per deployed strategy | | Post-Hoc Analytics | Performance attribution, execution quality analysis, and comparison across deployment versions | All trade instructions generated by the Exchange Algo System are submitted through the same Terminal OMS path as all other order sources. The OMS applies identical pre-trade validation, risk checks, and smart routing regardless of order source - the Exchange Algo System cannot bypass any execution control. ### 6.2 Market Maker Subsystem The market maker subsystem implements a configurable, inventory-aware quote-posting engine that maintains two-sided markets on specified instruments across connected exchanges. Market making is treated as a first-class strategy type with its own operational framework, not as a generic strategy configuration. **Core Mechanisms** - Quote generation: bid/ask quotes based on a configurable spread model, reference price source (mid-market, VWAP, last trade, or composite), and current inventory position - Inventory management: maximum inventory limits enforced per instrument and per side; the engine actively skews quotes to attract offsetting flow as inventory approaches limits - Rebate optimisation: preferentially places maker orders; monitors fill rates dynamically and adjusts quote aggressiveness to maintain fill rate targets while maximising rebate capture - Reference price management: supports multiple reference price sources per instrument; switchable without restarting the bot A dedicated simulator runs the market maker engine against historical or live data in paper mode, providing realistic pre-deployment validation including queue position simulation, partial fill modelling, and fee and rebate realisation. ### 6.3 HFT Strategy Framework High-frequency trading strategies are managed as a distinct subsystem given their fundamentally different operational requirements: microsecond-sensitive latency targets, order-per-second throughput requirements that exceed the standard strategy framework, and risk controls calibrated to the compressed time horizon. - Dedicated execution fast-path in the OMS for HFT orders; pre-trade validation is maintained but certain analytics steps are deferred to avoid adding latency - Explicit latency targets per order type in strategy configuration; the system monitors achieved latency against targets and alerts when sustained latency exceeds threshold - Per-strategy throughput limits that sum below the Rust engine's capacity envelope, preventing strategy competition for throughput - Risk controls at a faster cycle time than standard risk agents - position limits and drawdown checks on every order, not at bar close - Microsecond-granularity execution quality tracking for latency attribution and strategy optimisation ### 6.4 Algorithm Bots The Algorithm Bots framework provides a general-purpose deployment environment for user-defined automated strategies that do not fit the exchange algo or HFT frameworks. The full bot lifecycle is managed by the platform: creation and configuration through a structured interface, paper mode and simulator testing before live deployment, managed process execution with health monitoring and automatic restart on failure, real-time monitoring dashboards, and complete history of configurations, deployments, and performance retained for audit and comparison. ## Part VII: Markets & Analytics Suite The Markets & Analytics Suite is the platform's market intelligence infrastructure - the data environment in which all trading and strategy decisions are made. It provides professional-grade analytical depth across market data, derivatives intelligence, volume analysis, sentiment, and machine learning feature computation. ### 7.1 Core Market Data - Real-time snapshot: price, volume, and market cap across the full instrument universe updated at tick frequency from exchange feeds - Token details: full profile including exchange listings, on-chain metrics, trading pair analysis, and historical OHLC at configurable resolution - Market screener: configurable screener with price, volume, momentum, volatility, and sentiment filters; results ranked and updated in real time - News hub: aggregated market news with per-asset filtering, sentiment scoring, and configurable alerts for breaking news on monitored assets ### 7.2 Derivatives Analytics Institutional-grade derivatives market intelligence covering the data that professional traders use to understand positioning and identify structural opportunities: | Metric | Coverage | |---------------------|----------| | Funding Rates | Per-exchange perpetual swap funding rates; historical funding time series; anomaly detection for extreme funding environments; configurable alerts | | Open Interest | Aggregate OI by asset and exchange; OI change as a momentum and positioning signal; OI concentration analysis | | Liquidations | Real-time and historical liquidation data; liquidation cluster identification for support/resistance context; cascade risk assessment | | Long/Short Ratios | Top-trader and aggregate long/short ratios from exchanges that publish this data; ratio extremes as contrarian indicators | | Spot-Futures Basis | Basis tracking across instruments; carry opportunity identification; basis convergence monitoring | ### 7.3 Volume Analytics & Anomaly Detection The volume analytics module goes beyond raw volume reporting to provide anomaly detection and wash-trading-oriented analysis - a differentiating capability relative to platforms that report exchange volume uncritically. - Per-exchange volume breakdown: deviations from historical exchange volume share are flagged automatically - Volume anomaly detection: statistical models identify spikes inconsistent with price action, order flow, or historical patterns - Intraday volume profiling: compares intraday distribution against historical profiles to identify abnormal concentration - Cross-exchange correlation: genuine market activity tends to produce correlated volume across venues; wash trading on a single exchange produces uncorrelated volume that stands out in cross-exchange analysis ### 7.4 Sentiment, Momentum & Alternative Indicators | Dashboard | Data & Signals | |----------------------------|----------------| | Sentiment / Fear & Greed | Fear & Greed Index with historical time series; component decomposition (volatility, volume, momentum, social, dominance); threshold alerts | | Momentum | Cross-asset momentum ranking; momentum score per instrument; momentum regime classification (accelerating, peak, decelerating, trough) | | AltSeason Index | Percentage of top altcoins outperforming Bitcoin over trailing periods; historical altseason identification; rotation signals | | Thermograph | Market heat map visualising price performance across the instrument universe on configurable timeframes | | Social Intelligence | Twitter/X mention volume, Reddit engagement, Telegram activity; trending topics; unusual social activity detection per asset | | AI Regime Indicators | Platform-generated regime signals from the AI intelligence layer displayed as contextual overlays in the markets interface | ### 7.5 ML Feature Store The feature store is the quantitative analytics backbone connecting raw market data to machine learning model inputs. Features are computed at different frequencies to match their consumers: tick frequency for execution agents and real-time risk, scheduled updates for strategy allocation and regime detection. The feature catalogue tracks all computed features with metadata - computation logic, update frequency, data dependencies, and consuming models. Distribution monitoring detects feature drift that may indicate data quality issues or market regime shifts requiring model recalibration. ## Part VIII: Paper Trading System Paper trading is a fully featured subsystem that uses the same OMS, strategy framework, and risk controls as live trading. Orders are intercepted at the venue selection stage and fills are simulated from live order book state rather than submitted to an exchange. The OMS processes synthetic fills identically to live fills: positions are updated, P&L is computed, and all downstream analytics are populated. Full order type support is available in paper mode - market, limit, TWAP, VWAP, Iceberg - with the same pre-trade validation and risk checks as live trading. Paper and live portfolios are maintained in parallel and both visible in the same portfolio dashboard. Paper portfolios can be reset to a clean state, with reset history logged for audit. The paper trading engine also powers the Exchange Algo Simulator and Market Maker Simulator, providing realistic pre-deployment validation environments for those subsystems. ## Part IX: System Integration & Data Architecture ### 9.1 Unified Data Infrastructure All platform components share a common data infrastructure layer - the technical foundation for the cross-layer feedback loops that drive system improvement. Every component can read data produced by every other component through typed interfaces, subject to access control. There is no data siloing. | Data Store | Technology | Primary Use | |---------------------|-----------------------------|-------------| | Relational Database | PostgreSQL (HA cluster) | User accounts, strategy configurations, campaign data, audit logs | | Time-Series Database| TimescaleDB | Market data, execution metadata, performance metrics, system telemetry | | Cache Layer | Redis (cluster mode) | Session state, real-time position cache, real-time event pub/sub | | Document Store | MongoDB | Strategy specifications, campaign briefs, KOL profiles, AI model configurations | | Event Streaming | Apache Kafka | Cross-component event bus; guaranteed delivery; ordered event log with replay | | Object Storage | AWS S3 | Historical data archives, model artefacts, audit log cold storage | ### 9.2 Cross-Layer Data Flows The Terminal publishes a post-trade execution event for every completed order containing: instrument, venue, order type, quantity, fill price, reference price at submission, slippage in basis points, time-to-fill, and maker/taker classification. These events are consumed in real time by the AI execution agents for heuristic updating and by the performance attribution system for strategy evaluation. The AI system publishes trade instructions as structured objects containing: strategy identifier, instrument, direction, quantity, urgency level, maximum slippage tolerance, time-in-force, and venue constraints. The Terminal does not execute strategy logic - it executes the instruction it receives. When a Syndicate-attributed user executes a trade through the Terminal, the OMS attaches the attribution token to the trade record at write time - this attachment cannot be stripped or modified by downstream components. ### 9.3 Network Effects & Data Compounding The platform generates four compounding data assets that increase in value with scale and operational time: | Data Asset | How It Grows | How It Improves the System | |-------------------------------|--------------|----------------------------| | Execution Metadata Library | Every trade adds a venue/timing/conditions/slippage data point | Routing ML models become more accurate; slippage estimates tighten; venue scoring improves | | Regime History Database | Every observed regime transition extends the HMM training set | Regime detection accuracy improves; transition timing estimates sharpen | | Attribution Conversion Data | Every campaign adds attributed user conversion and LTV observations | CAC models improve; audience-to-conversion predictions sharpen; budget allocation optimises | | Strategy Performance Registry | Every live strategy generates out-of-sample performance data | Allocation models improve; ensemble construction becomes more sophisticated | ## Part X: Technology Stack ### 10.1 Execution Layer | Component | Technology | Rationale | |----------------------|-----------------------------|-----------| | Execution Engine | Rust | Memory safety without GC; zero-cost abstractions; 900+ OPS throughput; deterministic performance | | Order Book Processing| Rust with lock-free data structures | Microsecond processing requires lock-free concurrent access to shared order book state | | Exchange Adapters | Rust async (Tokio runtime) | Async I/O for hundreds of concurrent WebSocket connections without thread-per-connection overhead | | OMS State | PostgreSQL + Redis | Durable order state in Postgres; fast hot-state access in Redis; Redis pub/sub for event notification | | FIX Engine | Rust (QuickFIX-RS) | Native Rust FIX implementation; consistent latency profile with rest of execution stack | ### 10.2 Intelligence Layer | Component | Technology | Rationale | |----------------------|-----------------------------|-----------| | Agent Orchestration | LangGraph (Python) | DAG execution semantics; explicit state management; conditional branching; LangChain integration | | Agent Implementation | LangChain (Python) | Standardised agent interface; tool use; memory management; multi-provider model access | | ML Models | PyTorch + scikit-learn | LSTM/transformer for price prediction; gradient-boosted trees for routing and regime features | | Strategy Execution | Python (FastAPI) | Strategy logic, signal pipeline, backtesting engine, performance attribution | | Historical Data | TimescaleDB (SQL) | Time-series optimised queries; continuous aggregates for OHLCV; hypertable partitioning | | Feature Store | Redis + PostgreSQL | Sub-millisecond real-time feature access in Redis; historical materialisation in Postgres | ### 10.3 Frontend | Component | Technology | Role | |-----------------|-------------------------------------|------| | Framework | React 18 + TypeScript | Component model; concurrent rendering for real-time data; full type safety | | Build Tool | Vite | Fast development and production builds; native ESM | | Server State | @tanstack/react-query | Server state fetching, caching, synchronisation, and optimistic updates | | API Client | tRPC (TypeScript) | Type-safe API calls with automatic type inference from server schema; zero runtime type errors | | Charting | TradingView Charting Library | Institutional-grade charting; custom indicators; WebSocket data binding | | Workflow Builder| React Flow | Visual node-based editor for AI Hedge Fund flow construction and automation pipeline configuration | | Routing | React Router v6 | Client-side routing; route-level code splitting; protected route enforcement | ### 10.4 Infrastructure & Deployment | Component | Technology | Rationale | |--------------------|-----------------------------|-----------| | Orchestration | Kubernetes (EKS + GKE) | Multi-cloud; horizontal autoscaling; self-healing; declarative configuration | | Cloud | AWS (primary) + GCP (secondary) | Redundancy; best-of-breed services per provider; no single-cloud dependency | | CDN / DDoS | Cloudflare | Edge caching; DDoS mitigation; WAF; bot detection at network edge | | Event Streaming | Apache Kafka (managed) | Guaranteed delivery; ordered event log; replay capability for recovery | | Observability | Prometheus + Grafana | Real-time metrics; custom dashboards; SLO tracking; alerting | | Distributed Tracing| Jaeger | End-to-end request tracing across services; latency attribution; error root cause | | CI/CD | GitHub Actions + ArgoCD | Automated testing; GitOps deployment; progressive rollout | ## Part XI: Security & Reliability ### 11.1 Authentication & Access Control - OAuth 2.0 with PKCE for all user-facing authentication flows; short-lived access tokens with rotating refresh tokens - Multi-factor authentication enforced for all accounts - TOTP required; hardware key (FIDO2/WebAuthn) supported for institutional accounts - Role-based access control with fine-grained permission scopes; institutional accounts support sub-account permission hierarchies - IP allowlisting available for institutional and API-only accounts - Device fingerprinting with trust management: unrecognised devices trigger step-up authentication; trusted devices maintain a configurable trust window - Progressive account lockout on repeated authentication failures with automatic unlock notification - Dedicated token revocation service: all tokens revoked immediately on password change; admin-initiated emergency revocation available ### 11.2 Data Security - AES-256 encryption for all data at rest; 90-day key rotation schedule; keys managed through AWS KMS - TLS 1.3 enforced for all network communications - Exchange API credentials stored encrypted; decrypted only in-memory at execution time; never written to logs - Database field-level encryption for PII, API keys, and financial identifiers - No user funds held by the platform - custody risk is eliminated by design ### 11.3 API Security - HMAC-SHA256 request signing; replay attack prevention via nonce and timestamp validation - Rate limiting at the API gateway: per-user, per-endpoint, and per-IP limits with adaptive throttling - WAF rules at the Cloudflare edge: SQL injection, XSS, and path traversal protection - API key scoping: read-only, trade-only, and withdrawal-restricted key types; institutional sub-keys with further restricted scopes ### 11.4 Security Audit Log An immutable, append-only security audit log records all security-relevant events: authentication attempts, account changes, API key lifecycle events, admin actions, and device registration events. The audit log is tamper-evident, retained for regulatory reporting, and archived to cold storage after the hot retention window. ### 11.5 Reliability Architecture The system is designed for a 99.9% uptime target measured against the execution-critical path. The 90-day beta achieved 99.94%. - Component isolation: exchange adapters run in isolated processes; a crash in one adapter cannot affect others or the core OMS - Circuit breakers: every external dependency has a circuit breaker that opens on sustained failure; open circuits route to fallback behaviour rather than retrying indefinitely - Graceful degradation: the execution engine degrades gracefully under partial connectivity - if smart routing cannot score all venues, it routes to available venues using a simplified scoring function rather than failing the order - Automatic reconnection: all exchange connections reconnect automatically with exponential backoff and jitter; sequence numbers are validated on reconnect to detect and fill any data stream gaps ### 11.6 Incident Management Incidents are classified by severity with predefined escalation paths and response procedures. All significant incidents require a post-incident review whose findings feed directly into system design updates, monitoring threshold adjustments, and operational documentation - incidents are treated as data, not noise. ### 11.7 Compliance | Area | Posture | |---------------|---------| | SOC 2 Type II | Controls designed to SOC 2 standard from inception; certification audit planned for end of Year 1 | | KYC / AML | KYC at account registration; AML monitoring on transaction patterns; FATF travel rule compliance | | GDPR | Data residency controls; right-to-erasure; processing agreements with all sub-processors; DPO designated | | VARA (UAE) | Operating entity maintains VARA compliance posture as a technology platform provider | | Audit Trail | Complete event log retained for all system operations; configurable retention with tiered hot/warm/cold storage | ## Part XII: Performance Benchmarks & Validation ### 12.1 Execution System - 90-Day Beta Results **MEASUREMENT CONDITIONS** Duration: 90 days of continuous live system operation Instruments: BTC/USDT and ETH/USDT perpetuals (primary); 12 additional instruments (secondary) Exchanges: Binance, OKX, Bybit active throughout; 6 additional exchanges partial periods Environment: production system with live trading accounts and real capital | Metric | Measured | Target | Notes | |-------------------------------------|----------|----------|-------| | Internal routing latency (p50) | 6.2ms | <10ms | Order receipt to venue submission | | Internal routing latency (p95) | 9.1ms | <10ms | Met at p95; occasional spikes at p99 in market stress | | Order acknowledgement (p50) | 34ms | <50ms | Includes exchange processing; venue-dependent | | Order acknowledgement (p95) | 87ms | <100ms | Bybit consistently lowest at ~28ms median | | Limit order fill rate | 99.7% | >=99% | Normal conditions; degrades to ~97% in extreme volatility | | Slippage - BTC/USDT perp | 4.2bp | <8bp | Measured against mid-price at signal time | | Slippage - ETH/USDT perp | 5.8bp | <10bp | Wider spread instrument; within target | | Rust engine throughput | 917 OPS | >=900 OPS | Under sustained load; no degradation over 90 days | | System uptime | 99.94% | >=99.9% | Two planned maintenance windows; zero unplanned outages | ### 12.2 AI System Validation - Beta Period All figures are from live paper trading and limited live trading during the 90-day beta. Out-of-sample results use a walk-forward methodology. Past performance is not indicative of future results. | Strategy | Sharpe (OOS) | Max Drawdown | Win Rate | Calmar | Backtest Alignment | |---------------------------------|--------------|--------------|----------|--------|--------------------| | Trend Following - BTC perpetual | 1.42 | 8.3% | 54% | 2.1x | Within +/-15% | | Mean Reversion - ETH/BTC pair | 1.18 | 6.1% | 61% | 2.4x | Within +/-18% | | Volatility Expansion | 0.94 | 12.4% | 48% | 0.9x | Within +/-22% | | Cross-Exchange Arbitrage | 2.31 | 2.8% | 73% | 4.2x | Within +/-8% | | Portfolio Ensemble (blended) | 1.67 | 7.2% | 58% | 2.8x | Within +/-12% | **AI Validation Metric** - **Regime detection accuracy**: 78% correct classification vs. ex-post realised regime labels - **Execution agent slippage improvement**: 38% reduction in slippage vs. naive market order baseline on identical signals - **Risk agent intervention accuracy**: All automated de-risk triggers during beta correctly identified elevated risk conditions in retrospective review - **Learning convergence**: Slippage reduced by 1.8bp from Day 1 to Day 90 - measurable AI learning from live execution feedback - **Ensemble vs. single strategy**: Ensemble Sharpe (1.67) exceeds individual strategy Sharpe adjusted for correlation - diversification benefit confirmed ### 12.3 Independent Technical Review The TA Quant execution engine and AI system architecture has been reviewed by independent technical advisors with institutional trading systems backgrounds. Key findings: - Rust execution engine architecture correctly designed for deterministic, low-latency performance - consistent with institutional-grade execution systems - Agent separation-of-concerns implementation is sound - the boundary enforcement between alpha, execution, and risk agents is architectural, not conventional - Risk agent authority hierarchy correctly implements the veto pattern; no execution path exists that bypasses risk agent evaluation - Data pipeline from execution layer to AI feedback loop correctly implemented - no look-ahead bias identified in the learning system - Idempotency key implementation in the OMS correctly prevents double-submission in all tested failure scenarios ## Part XIII: Development Roadmap **Phase 1 - Foundation (Current)** Core system deployed and validated in beta. Full multi-exchange Terminal connectivity with all advanced order types and FIX engine. All five AI agent classes deployed with full feedback loop architecture live. TA Syndicate attribution infrastructure operational. AISA autonomous agent live. Exchange Algo System, Market Maker, HFT framework, and Algorithm Bots operational. Multi-region cloud deployment with full observability stack. **Phase 2 - Scale** Mobile applications for iOS and Android. Enhanced portfolio analytics and prime brokerage-adjacent features. Strategy marketplace public launch with external developer SDK. Self-serve Syndicate campaign platform. Enhanced narrative intelligence and expanded on-chain attribution for DeFi protocols. Geographic expansion. SOC 2 Type II audit. **Phase 3 - Enterprise** White-label Terminal deployment for exchange partners. DeFi and on-chain execution integration with DEX aggregation and cross-chain routing. Prime brokerage services including credit, margin, and custodian integrations. AI trading assistant with conversational strategy configuration interface. Advanced ML capabilities at the portfolio level. Decentralised attribution using on-chain proofs. **Phase 4 - Platform** Open developer API ecosystem enabling third-party strategy, signal, and analytics providers to integrate through published APIs. Global infrastructure with low-latency execution nodes in all major trading regions. Developer marketplace for approved integrations. TA Quant's long-term vision is to become the comprehensive infrastructure platform where every serious trader, fund, and project operates by default. | Technical Priority | Phase 1 | Phase 2 | Phase 3 | Phase 4 | |------------------------|------------------|---------------------|--------------------------|--------------------------| | Execution latency | Sub-10ms | Sub-5ms target | Co-location partnerships | Sub-1ms co-located | | Exchange coverage | 50+ CEX | CEX + DEX integration | CEX + DEX + OTC | Full market structure | | AI model refresh | Daily cycle | Hourly updates | Real-time tick-level | Continuous adaptation | | Attribution | CEX volume | CEX + DeFi | Multi-chain | Decentralised proof | | Uptime target | 99.9% | 99.95% | 99.99% | 99.99%+ | ## Conclusion The TA Quant architecture reflects a specific thesis about what it takes to build durable infrastructure for professional crypto markets: that execution quality, trading intelligence, growth attribution, and autonomous execution are not independent problems, and that the integration between them is not a convenience but a technical requirement for the feedback loops that make the system improve continuously. Every major architectural decision in this document follows from that thesis. Rust at the execution layer because deterministic performance is non-negotiable under market stress. Multi-agent AI with enforced separation of concerns because single-model trading systems fail in predictable ways that ensemble architectures avoid. Full-funnel attribution anchored to the execution layer because attribution without execution control produces self-reported data. AISA as a policy-constrained autonomous agent because professional traders increasingly require infrastructure that removes the operational burden of trade execution without removing their control. The 90-day beta has validated the core architecture. Sub-10ms internal routing latency, 99.94% uptime, measurable AI learning convergence, and attribution chains fully auditable to the individual trade. These are measured outcomes from a production system operating on live capital - not design targets. The platform compounds. Each revolution of the execution-intelligence-attribution flywheel produces data that improves the next. Each new exchange partnership, attributed user, and strategy deployment makes the system measurably better. The roadmap ahead is an expansion of the same architectural principles into deeper product surfaces and broader markets. **TA QUANT - TECHNICAL WHITEPAPER** **March 2026 - taquant.com** © 2026 TA Quant. All rights reserved.
Read Summary →AISA: TAQuant AI Strategy Agent System
# AISA: TAQuant AI Strategy Agent System **Integrating proof-of-concept of agentic QLOB trading** **And research models** **Technical Research Report** **TYLER LEONARD** **TA QUANT RESEARCH LABS** **January 2026** --- # The TAQuant AI Strategy Agent System **TAQuant Research** ## Abstract We introduce the TAQuant AI Strategy Agent (AISA), an autonomous trading system that learns and executes quantitative strategies in real financial markets. AISA is designed as a capital-executing, policy-learning agent operating within a hedge-fund–grade infrastructure. Its multi-agent architecture partitions trading tasks (e.g. data analysis, strategy evaluation, execution) into specialized components, each with clear responsibilities and interlocks to ensure safety and auditability (see Fig. 1). The system employs an event-sourced pipeline: all market data and internal signals are logged immutably, enabling offline policy training and full replayability (Appendix B). We integrate a market-regime classifier (Appendix A) to contextualize decisions, and we enforce rigorous governance – including policy versioning, gated approvals, and multi-tier kill-switches – to maintain oversight. Strategy ingestion and adaptation occur offline with delayed updates, while human experts can validate or refine policies (analogous to a “fund manager” role). We also address multi-agent training: competing policy versions are maintained and evaluated, and explainable decision logs allow post-hoc analysis. This paper details the system architecture, design methodology, evaluation considerations, and discusses limitations and future work, all in the style of a formal quantitative finance research framework. ## Introduction Autonomous agents are increasingly studied for algorithmic trading, but deploying them safely in live markets remains a challenge. Financial markets feature many strategic participants and nonstationary regimes, so single-agent methods can fail to capture market complexity. Multi-agent frameworks attempt to mirror the structure of professional trading desks; for example, TradingAgents and HedgeAgents introduce specialized analyst and trader roles within LLM-powered systems. These systems allocate distinct tasks – sentiment analysis, fundamental research, risk oversight, order execution, etc. – to dedicated agents, often under a central coordinator. Empirical studies, however, report that even well-designed automated trading systems can underperform in volatile or crisis scenarios (e.g. DeepTrader and FinGPT incurred large losses in rapid market declines). Furthermore, regulators have raised concerns over model governance: in early 2025 the SEC cited a major quantitative fund for failures in oversight and auditability of model changes. Similarly, research has shown that unconstrained reinforcement-learning (RL) agents can converge to implicit collusion or “cartel-like” behaviors without explicit intent. These examples underscore that outcome-only oversight is insufficient. TAQuant AISA is designed to address these issues. It is a reinforcement-learning–driven trading agent integrated into a robust governance framework. Our contributions include: (1) an event-driven system architecture that cleanly separates strategy logic, execution, and risk management; (2) rigorous policy versioning, audit logs, and kill-switch mechanisms; (3) a taxonomy of market regimes (Appendix A) used to adapt strategies; (4) a structured workflow for strategy ingestion, delayed offline learning, and human feedback; (5) support for multi-agent policy competition, policy evolution, and explainable decision logging. We discuss related work on AI in trading and RL (Section 2), detail the AISA system architecture (Section 3) and methodology (Section 4), and outline evaluation, limitations, and future directions. ## Related Work ### Reinforcement Learning in Finance RL and deep learning have been applied to trading and portfolio problems, but traditional RL faces well-known hurdles in finance (nonstationarity, sample inefficiency, and limited interpretability). Recent surveys emphasize that market dynamics are time-varying and require adaptive, regime-aware models. Pure RL agents (e.g. DQN, PPO) can optimize sequences of trades, but may overfit or produce unsafe strategies without domain guidance. Hybrid approaches attempt to combine strengths of different AI: for instance, a recent study uses a large language model (LLM) to propose high-level trading policies that guide an RL executor. Such architectures resemble institutional workflows where strategic insights are generated and then enforced by automated execution (echoing the multiple layers of oversight in a trading desk). ### Multi-Agent Trading Systems Inspiration from human trading firms has led to multi-agent frameworks. TradingAgents, for example, organizes agents into Analysts (fundamental, sentiment, technical), Researchers (bullish/bearish debate), Traders, and Risk Managers. HedgeAgents similarly builds a “well-balanced” set of experts and a fund manager who orchestrates them. These systems leverage agent specialization and structured communication to improve decision quality. Compared to monolithic models, multi-agent designs can naturally enforce separation of concerns and modular updates. Our AISA follows this paradigm by allocating different decision steps to distinct modules (see Fig. 1). Unlike prior work that focuses on raw trading performance, we emphasize **verifiability**: we embed logging and oversight at each stage so that all agent actions can be audited. ### Governance and Risk Controls Institutional algorithmic trading must satisfy model risk guidelines (e.g. Fed’s SR 11-7), which require strict version control, validation, and documentation of predictive models. In practice, this means “all predictors, policies, and controllers are versioned, artifacts (code, configs, thresholds) are immutable” and any change is gated through reviews (backtests, stress tests, documentation of data lineage, etc.). Our design aligns with these principles. We employ multi-tier kill-switches and detailed audit trails, logging nanosecond timestamps for every input, decision, and order. This “evidence-first” architecture addresses known failures: e.g., the Two Sigma case in 2025 showed that even with logs, investigators struggled to determine when and how a trading model was altered. By contrast, TAQuant’s event-sourced system (Appendix B) makes the internal decision process independently verifiable. ## System Architecture The TAQuant AISA system follows an event-driven, layered architecture (Figure 1). Incoming market data events (tick prices, order-book updates, news signals, etc.) enter a **Signal Processing** pipeline that normalizes and enriches information. These events trigger the **Strategy Engine** which evaluates the current market state under one or more trading policies. Each policy runs in isolation (e.g. in separate containers) to prevent cross-contamination of state. The strategy engine outputs candidate trade signals. Each signal is then sent to the **Risk Management** layer, which enforces portfolio- and strategy-level constraints (position limits, sector exposures, drawdown bounds, etc.). Signals that violate risk rules are blocked and logged for analysis; approved signals proceed to the **Execution Interface**. **Figure 1: Exemplary multi-agent trading system architecture.** The TAQuant AISA instantiates similar components: data/analysis agents, strategy agents, execution agents, and a risk-management agent. Approved signals are translated into exchange orders by the Execution Interface. This module chooses order types, venues, and routing strategies, and manages dynamic adjustments (order amendments or cancellations) as market conditions evolve. All actual fills and market reactions are fed back to the system for performance attribution and latency analysis. AISA continuously tracks execution quality (slippage, fill rates, timing) to inform both strategy evaluation and risk monitoring. Each component is connected by an **event log**: every market update, internal decision, and order message is timestamped and recorded in an immutable log (see Appendix B). This event-sourced design supports full replayability and auditability. For example, the execution interface will log the exact orders sent, their acknowledgments, and execution details, enabling offline reconstruction of every trade decision and outcome. The architecture also incorporates a **Regime Classification** module. AISA classifies the current market regime (e.g. bull, bear, sideways, high volatility, liquidity-crunch, etc.; Appendix A) and tags each event stream accordingly. This contextual label is provided as input to strategy models or policy-selection logic. Internally, regime classification is implemented with ML models (e.g. using PyTorch/MLflow) as part of the strategy infrastructure. Overall, the design enforces separation of concerns: Strategy logic, Execution mechanics, and Risk controls are kept in distinct layers. This separation (mirroring institutional desks) simplifies testing and auditing of each layer independently. Cross-module interfaces are carefully defined so that, for instance, strategy models cannot place orders directly without passing through risk and execution checks. We also employ containerization and CPU/memory limits to isolate components, preventing a rogue strategy from impairing the system. ## Methodology AISA’s operational workflow is as follows: each trading day, the system ingests live market feeds through the event-driven pipeline, incrementally updating all strategy state. Agents output potential orders in real time, subject to risk gating as described above. Crucially, **no new learning happens during live trading**. Instead, all market events and decisions are logged and used to train or refine policies offline. This delayed offline learning approach ensures that live capital is never risked on untested policy updates. New model parameters or strategy definitions are only deployed after a validation cycle (see below). ### Strategy Ingestion and Human Feedback New trading strategies (e.g. algorithmic rules or learned policies) enter the system through a controlled “ingestion” process. Strategies may originate from in-house development, external researchers, or even LLM-generated proposals. Each candidate strategy is first verified in a sandbox (backtests and paper trading). After passing automated checks, a strategy can be reviewed by human experts (e.g. a senior quant or portfolio manager). The expert can accept, reject, or suggest modifications, and this feedback is recorded. Thus, human analysts act as a final layer of oversight before a strategy is put into production. Accepted strategies become new policy versions managed by our version control system. ### Offline Learning and Policy Updates Periodically (e.g. nightly or weekly), the collected event logs are used to retrain or update strategy models. For example, an RL agent’s replay buffer is filled with recent trade experiences, and policy/value networks are trained against historical market data. Since all market regimes are represented in the logs (tagged by the regime classifier), training can be stratified or weighted by regime. Performance of new policy versions is evaluated via backtests and forward simulations. Notably, we run **multi-agent tournaments**: competing policy variants (including historical versions and new candidates) are simulated together in a market model to identify dominant strategies. This competition helps to avoid overfitting to a single market path and to encourage diversity of strategies. ### Policy Versioning and Replayability Every policy version is uniquely tagged and stored (including code, hyperparameters, random seeds). When evaluating or deploying a policy, the exact version can be retrieved. Because the system logs full event histories, any version can be replayed on past market data for analysis. This replayability enables robust testing: for instance, one can simulate how an older version would have acted in a crisis scenario. It also underpins our explainability pipeline: for any trade made in live operation, we can trace back through the logs to produce a rationale. In practice, the system records additional metadata (e.g. key input features or even LLM reasoning snippets) alongside each decision. These serve as an audit trail and as inputs to automated explanations (e.g. “The model bought ABC because strong technical momentum was detected under bullish regime X”). ### Multi-Agent Collaboration Although AISA operates as one integrated system, its internal components can be viewed as “agents” cooperating on the trading task. For example, we implement separate neural modules for signal prediction and for portfolio allocation, which iteratively communicate (in a manner akin to the Researcher–Trader teams of TradingAgents). We also incorporate sentiment or fundamental analysis modules which feed into strategy models. In ongoing work, we experiment with true multi-agent architectures, where multiple policies trade in a shared simulation to model market impact or implied competition. Regardless of the exact agent count, our platform supports structured dialog and data passing among agents: they communicate via shared state objects rather than free-form text, which preserves context and avoids loss of information. ## Evaluation Considerations Evaluating an autonomous trading agent requires both performance and safety analyses. We employ extensive backtesting on historical data, ensuring that test sets include diverse regimes (as listed in Appendix A). Key performance metrics include annualized return, Sharpe/Sortino ratios, maximum drawdown, and tail risk (CVaR) – standard measures in quantitative trading. We also measure execution quality (slippage, fill rates, latency) and risk compliance (how often signals were vetoed by the risk layer). Statistical significance is gauged via bootstrap confidence intervals or block-permutation tests on returns, taking care to avoid lookahead bias. Importantly, stress scenarios are simulated by isolating extreme market conditions (e.g. flash crashes, low-liquidity periods). We verify that at each of these scenarios, regulatory constraints (e.g. position limits, kill-switch thresholds) would trigger appropriately. Moreover, drift monitors are in place: if a deployed policy’s live behavior deviates significantly from its backtest profile (in terms of selected features or PnL sources), alerts are raised and a retraining cycle is initiated. This live monitoring layer (akin to adversarial testing) complements offline evaluation and is necessary for production readiness. ## Limitations Like all AI-driven trading systems, AISA has inherent limitations. Markets are non-stationary and may shift into regimes not seen in historical training data (e.g. black swan events). Our regime-classification approach mitigates this by detecting shifts, but rapid regime changes can still degrade policy performance. Model risk remains: if input data streams fail or are spoofed, the system could make erroneous trades. While multi-tier kill-switches (per strategy, per asset, or global) provide emergency stops, they cannot prevent all adverse outcomes. Another concern is emergent behavior: multiple learning agents acting in the same market (or on correlated assets) might collectively produce unintended equilibria. Indeed, prior experiments have observed that independent RL agents can inadvertently collude, stabilizing prices in a way akin to market cartels. Ensuring that AISA’s agents remain competitive yet benign is an ongoing research challenge. Finally, the use of powerful models (LLMs or deep nets) means decisions can be opaque; while we log rationales for each action, true interpretability is limited. Explainability features are heuristic and may not satisfy all regulatory standards. Balancing model complexity with transparency is an inherent trade-off. ## Future Work Future extensions of the TAQuant AISA include richer agent interactions and learning schemes. For example, we plan to explore meta-learning so that the system can adapt more rapidly to new regimes. Incorporating counterparty modeling (simulating how other market participants react) and adversarial testing will improve robustness. We also aim to enhance explainability, perhaps by integrating techniques like SHAP values for model features, or by constraining agents to use interpretable strategies when possible. On the governance side, research into cryptographic audit proofs (as suggested by recent proposals for “verification-first” oversight) could further strengthen trust. As regulations evolve, we will update our compliance modules accordingly (e.g. embedding SR 11-7 documentation directly into the model repository). Finally, real-world trials with careful A/B deployment could validate the system’s effectiveness and illuminate new limitations to address. ## Appendix A: Market Regime Classification Taxonomy We classify market regimes into the following categories to inform strategy behavior. Each regime is characterized by typical price/trend patterns and volatility levels: - **Bull Market (Uptrend)**: Sustained upward price movements across broad asset classes. Momentum strategies tend to perform well. Low drawdowns; positive sentiment. - **Bear Market (Downtrend)**: Prolonged downward trends. Mean-reversion and hedging strategies can help. Typically higher volatility and negative autocorrelation in returns. - **Sideways / Range-Bound**: Prices oscillate within a bounded range, lacking clear trend. Volatility may be moderate but without directional bias. Oscillator-based strategies often dominate. - **High-Volatility / Turbulent**: Rapid price swings and frequent large gaps. Any strategy must manage wide bid-ask spreads and slippage. Risk aversion is key, as drawdowns can spike. (This corresponds to “rapid decline” or “frequent fluctuation” regimes noted in RL studies.) - **Low-Volatility / Calm**: Market moves are small and stable. Trend-followers may be side-lined; carry or yield-seeking strategies (e.g. earnings or sentiment plays) may excel. - **Liquidity-Crunch**: A regime with thin trading or disrupted order books (e.g. during holidays or exchange outages). Execution risk is high; strategies may throttle participation. - **Event-Driven / News Shock**: Regime triggered by specific events (earnings, macro announcements, geopolitical news). Characterized by sudden volatility spikes and regime shifts. Strategies typically pause or switch to news-processing modes. In Appendix B we describe how AISA detects and logs these regimes. This taxonomy (informed by literature on regime changes) is periodically reviewed and can be refined by unsupervised learning on recent market data. ## Appendix B: Event-Sourced Architecture and Learning Boundaries AISA’s internals follow an event-sourced design: every piece of data (market tick), every agent decision, and every execution outcome is appended to an immutable log. This log effectively becomes the single source of truth for the system’s history. All policy training is done exclusively offline on this logged data. In practice, the live trading process is a consumer of the log (reading data, writing events) but does not itself update model parameters. Instead, learning pipelines read from historical logs to produce new model versions, which are then deployed only after validation. This separation creates clear learning boundaries: the live capital-facing engine does not self-modify under pressure. New strategies or model updates propagate only via controlled “ship-county” (blue-green) deployments, as in continuous-delivery practices. Because audit trails are cryptographically hashed (via our logging system), any attempt to alter history (e.g. a rogue file edit) would be evident. Audit logs also record the user or process ID for each action, so that questions of “who authorized this trade” can be answered without reliance on human testimony. In sum, by combining event sourcing with strict offline training cycles and multi-layer approval, TAQuant ensures that the system’s behavior is fully reproducible and its learning cannot “leak” unpredictably into live trading. ## References (References correspond to cited works above.) [8] Xiao et al., TradingAgents: Multi-Agents LLM Financial Trading Framework, arXiv:2412.20138 (2024). [14] Hoque et al., RL in Financial Decision Making: A Systematic Review, arXiv:2512.10913 (2025). [18] VeritasChain Standards Org., Audit Trails Are Not Enough: Why AI Trading Needs Verifiability, Medium (2025). [20] Darmanin & Vella, LLM-Guided RL in Quantitative Trading, FLLM 2025 (preprint). [22] Darmanin & Vella, Language Model Guided RL in Trading (abstract). [33] TAQuant Research, TA Quant Technical Whitepaper v1.0 (user file). [37] T. Green et al., Trading Algorithms in HFT: Governance and Monitoring, IJCTEC 8(5) (2025). [47] Zhang et al., HedgeAgents: A Multi-Agent Financial Trading System, WWW ’25 Companion (2025). [43] Hoque et al., RL in Financial Decision Making: Trends & Analysis, arXiv:2512.10913 (2025). ### Direct Links - [1] [10] [19] [20] ijctece.com https://ijctece.com/index.php/IJCTEC/article/download/205/167/324 - [2] [7] [8] Audit Trails Are Not Enough: Why AI Trading Needs Verifiability | by VeritasChain Standards Organization (VSO) | Dec, 2025 | Medium https://medium.com/@veritaschain/audit-trails-are-not-enough-why-ai-trading-needs-verifiability-8d0c366d2156 - [3] HedgeAgents: A Balanced-aware Multi-agent Financial Trading System https://arxiv.org/html/2502.13165v1 - [4] [5] Reinforcement Learning in Financial Decision Making: A Systematic Review of Performance, Challenges, and Implementation Strategies https://arxiv.org/html/2512.10913v1 - [6] [21] TradingAgents: Multi-Agents LLM Financial Trading Framework https://tradingagents-ai.github.io/ - [9] [13] [14] [15] [16] [17] [18] Technical Whitepaper [v1.0].md file://file-FrXATT6yXFK8pzvKXKM7kF - [11] [12] Language Model Guided Reinforcement Learning in Quantitative Trading Preprint under review for FLLM 2025. https://arxiv.org/html/2508.02366v1 ---
Read Summary →TAQUANT LITEPAPER
# TA Quant Litepaper ## Integrated Trading, Intelligence, and Attribution Infrastructure **January 2026** --- ## Abstract TA Quant is an integrated trading infrastructure platform designed to unify execution, intelligence, distribution, and economic optimisation into a single closed-loop system. Unlike traditional platforms that treat trading, analytics, and growth as independent domains, TA Quant approaches them as interdependent layers of the same system. The platform consists of four core layers: - [ ] **Execution Layer (Terminal):** A deterministic, high-performance trading engine built in Rust - [ ] **Intelligence Layer (TA Quant AI):** A multi-agent system replicating institutional quantitative trading workflows - [ ] **Distribution Layer (TA Syndicate):** A verifiable attribution infrastructure linking marketing activity to executed trading volume - [ ] **Control Layer (Financial Model AI):** A business optimisation system governing pricing, capital allocation, and economic efficiency TA Quant is designed to deliver institutional-grade performance, continuous learning, and full transparency across both trading and growth systems. --- ## 1. Introduction Digital asset markets remain fragmented across execution venues, data sources, and growth channels. Most platforms address these domains independently, leading to inefficiencies in execution, limited adaptability in strategy, and unverifiable attribution in user acquisition. TA Quant addresses this fragmentation through architectural integration. By unifying execution infrastructure, AI-driven decision-making, and attribution systems, the platform enables continuous feedback loops that improve performance over time. This litepaper presents a high-level overview of the system architecture, design principles, and functional components of the TA Quant platform. --- ## 2. System Architecture Overview TA Quant is structured as a four-layer system with shared data infrastructure and tightly controlled interaction boundaries. | Layer | Component | Function | |------|----------|---------| | Execution | TA Quant Terminal | Order execution and lifecycle management | | Intelligence | TA Quant AI | Signal generation, execution optimisation, and risk control | | Distribution | TA Syndicate | Marketing attribution and KOL infrastructure | | Control | Financial Model AI | Business optimisation and economic governance | Each layer operates independently within defined constraints while contributing to a unified feedback system. --- ## 3. Core Architectural Principles ### 3.1 Separation of Concerns Each system layer is strictly bounded in responsibility. Execution systems do not generate signals, and AI systems do not directly execute trades without validation. This separation is enforced programmatically. ### 3.2 Deterministic Execution The execution layer operates with deterministic logic under all market conditions. All probabilistic decision-making occurs upstream within the AI system. ### 3.3 Ensemble Intelligence The intelligence layer is composed of multiple specialised agents operating in parallel. No single model or strategy determines system performance. ### 3.4 Verifiable Attribution All attribution is anchored to execution data. Marketing claims are validated through deterministic linkage to executed trades rather than third-party reporting. ### 3.5 Closed-Loop Learning All layers generate feedback signals that are consumed across the system. Execution outcomes inform AI decisions, and attribution data informs growth strategies. --- ## 4. Execution Layer: TA Quant Terminal The Terminal is a high-performance execution engine built in Rust, designed for deterministic and low-latency order processing. ### Key Capabilities 1. - Multi-exchange connectivity across 50+ venues 2. - Smart order routing based on liquidity, cost, latency, and historical performance 3. - Advanced order types including TWAP, VWAP, Iceberg, and conditional orders 4. - Full order lifecycle management through a centralised Order Management System ### Performance Characteristics 1. - Sub-10ms internal routing latency 2. - High order throughput exceeding 900 orders per second 3. - High system uptime with minimal operational interruption ### Design Focus The execution layer prioritises reliability under stress conditions, ensuring consistent behaviour during volatility and infrastructure degradation. --- ## 5. Intelligence Layer: TA Quant AI TA Quant AI is a multi-agent system designed to replicate the functional structure of an institutional quantitative trading desk. ### Agent Classes 1. **Market State Agents** Detect volatility, trends, liquidity conditions, and anomalies 2. **Alpha Agents** Generate trading signals across multiple strategy families 3. **Execution Agents** Optimise order parameters such as venue selection and order type 4. **Risk Agents** Enforce strict risk controls with veto authority over all decisions 5. **Portfolio Agents** Allocate capital across strategies to maximise risk-adjusted returns ### System Characteristics - [ ] Parallel agent execution with shared state - [ ] Hierarchical decision-making with upstream authority enforcement - [ ] Continuous learning from live execution feedback ### Outcome The AI system improves over time through structured adaptation, while maintaining strict safety constraints. --- ## 6. Distribution Layer: TA Syndicate TA Syndicate is an attribution infrastructure that connects marketing activity directly to executed trading volume. ### Attribution Framework - [ ] Campaign event capture through cryptographic tokens - [ ] User journey tracking across platform interactions - [ ] Trade-level attribution via execution data - [ ] Optional on-chain attribution for decentralised protocols ### Key Features - [ ] Deterministic attribution without reliance on third-party reporting - [ ] KOL performance tracking based on verified outcomes - [ ] Campaign management with structured configuration and analytics ### Value Proposition TA Syndicate transforms marketing from a probabilistic activity into a measurable and auditable system. --- ## 7. Control Layer: Financial Model AI The Financial Model AI applies optimisation principles to the platform’s business operations. ### Functions - [ ] Pricing optimisation across user segments - [ ] Capital allocation guidance across strategies - [ ] Exchange routing optimisation based on fee structures - [ ] Cohort-level performance and retention analysis ### Decision Framework - [ ] Objective-driven optimisation - [ ] Hard constraints for risk and compliance - [ ] Scenario-aware adjustment logic ### Outcome The system ensures alignment between trading performance and business economics. --- ## 8. Data Infrastructure All components operate on a unified data infrastructure, enabling seamless cross-layer communication. ### Core Technologies - [ ] Relational databases for structured data - [ ] Time-series databases for market and execution data - [ ] Event streaming for real-time communication - [ ] Distributed caching for low-latency access ### Data Flow - [ ] Execution data feeds AI learning systems - [ ] AI outputs generate execution instructions - [ ] Attribution data links user activity to outcomes - [ ] Aggregated data informs business optimisation ### Result The platform benefits from compounding data effects, improving accuracy and efficiency over time. --- ## 9. Security and Reliability ### Security - [ ] Encrypted data storage and transmission - [ ] Multi-factor authentication and access control - [ ] Secure handling of exchange API credentials - [ ] Comprehensive audit logging ### Reliability - [ ] High system uptime targets - [ ] Fault isolation across components - [ ] Circuit breakers and graceful degradation - [ ] Automated recovery mechanisms ### Design Objective To provide institutional-grade reliability without custody risk. --- ## 10. Performance Validation During the beta period, the system demonstrated: - [ ] High execution reliability and low latency - [ ] Measurable reduction in slippage through AI optimisation - [ ] Strong alignment between backtested and live performance - [ ] Effective risk intervention mechanisms These results validate the architectural approach and system design. --- **End of Litepaper**
Read Summary →TAQ: Trade-Aware Quantizer for Behavioral State Inference and Adaptive Market Design from Trade Execution Data
# TAQ: Trade-Aware Quantizer for Behavioral State Inference and Adaptive Market Design from Trade Execution Data **Technical Report** **TYLER LEONARD** **TA QUANT RESEARCH LABS** **January 2026** ## Abstract Financial markets are traditionally modeled either as stochastic price processes driven by information arrival or as equilibrium outcomes of optimizing agents. Both views abstract away the rich heterogeneity and temporal structure of trader behavior observable at the level of trade execution. In this work, we introduce **TAQ (Trade-Aware Quantizer)**, a pretrained foundation model for multivariate trade execution time series that infers low-dimensional behavioral representations capturing execution style, aggressiveness, stability, and regime sensitivity. We formalize behavior as a latent variable within a partially observable dynamical system and learn behavioral embeddings through self-supervised sequence modeling on large-scale order flow data. These embeddings enable economically interpretable segmentation of market participants and serve as the basis for adaptive market mechanisms. We further demonstrate how TAQ-derived behavioral states can be mapped into deterministic exchange controls, fee schedules, and incentive mechanisms without relying on price prediction or profit optimization. Our framework unifies market microstructure, behavioral finance, and modern representation learning, providing both a theoretical lens on endogenous market dynamics and a practical blueprint for behavior-aware market design. TAQ emphasizes interpretability, auditability, and regulatory alignment, establishing behavioral inference as a foundational layer for next-generation financial infrastructure. ## 1. Introduction Modern electronic markets generate vast volumes of high-frequency execution data describing how participants interact with prices, liquidity, and one another. Despite this richness, most quantitative models reduce market behavior to aggregate order flow statistics or price-based signals, treating individual trader behavior as either noise or an unobservable externality. This abstraction limits both theoretical understanding and practical market design, particularly in environments characterized by rapid regime changes, liquidity fragmentation, and heterogeneous participant objectives. Empirical studies in market microstructure have long documented that different classes of traders such as market makers, informed traders, and liquidity demandersexert distinct effects on prices and liquidity. However, these classifications are typically static, coarse, and imposed *ex ante*. In practice, individual participants frequently shift execution style in response to volatility, risk constraints, or strategic pressure. Capturing such dynamics requires models that treat behavior itself as an object of inference rather than a fixed assumption. In parallel, recent advances in machine learning have demonstrated the power of sequence models and representation learning for extracting structure from complex temporal data. While these methods have been applied extensively to price forecasting and portfolio construction, their use in modeling trader behavior remains limited. Moreover, most existing approaches focus on predictive accuracy rather than interpretability, economic grounding, or regulatory suitability. This paper proposes a different perspective. We model financial markets as systems of interacting behavioral agents and focus on inferring latent behavioral states directly from execution-level time series. Rather than predicting future prices or optimizing trading performance, the objective is to understand how participants act under varying market conditions and how these actions collectively shape market outcomes. Our main contribution is **TAQ**, a tokenizer-based foundation model pretrained on massive trade execution datasets that produces high-quality behavioral embeddings for downstream market design tasks. Our contributions are threefold: 1. We introduce a formal latent-state model of trader behavior inferred from sequences of trade execution events conditioned on market context. 2. We demonstrate how learned behavioral embeddings enable stable and economically meaningful segmentation of market participants, capturing both short-term tactical behavior and long-term strategic identity. 3. We show how these behavioral signals can be integrated into adaptive yet deterministic market mechanisms, including fee schedules, throttles, and incentive systems, without compromising transparency or fairness. ## 2. Related Work The proposed framework draws on and extends several strands of prior research, including classical market microstructure theory, behavioral finance, agent-based modeling, and recent advances in time-series representation learning. Traditional microstructure models, such as those based on informed trading and inventory risk (Kyle, 1985; Glosten and Milgrom, 1985), characterize order flow using stylized assumptions about trader types and information asymmetry. While analytically tractable, these models typically assume fixed behavioral roles and do not account for within-agent behavioral variation over time. Behavioral finance relaxes strict rationality assumptions and introduces psychological and institutional frictions (Kahneman and Tversky, 1979; Shleifer, 2000), yet often lacks a direct link to high-frequency execution data. Empirical behavioral studies frequently rely on aggregate statistics or survey-based proxies rather than direct observation of trading actions. Agent-based models (LeBaron, 2006; Farmer and Foley, 2009) provide a flexible framework for simulating heterogeneous agents but depend heavily on hand-specified strategies and parameters. As a result, their realism and empirical grounding are often limited. More recently, deep learning models for time-series data have achieved state-of-the-art performance in forecasting and representation learning. The Chronos family of models (Ansari et al., 2024) demonstrated that treating time series as a language and applying transformer architectures enables powerful zero-shot forecasting. Self-supervised contrastive learning approaches, including InfoNCE-based methods (van den Oord et al., 2018) and temporal contrastive coding (Yue et al., 2022), have shown remarkable success in learning representations from unlabeled time series data. Our work bridges these domains by using modern sequence modeling techniques to infer latent behavioral states from real execution data, while maintaining explicit economic interpretation and applicability to market mechanisms. ## 3. Framework Overview At a high level, the proposed system consists of four conceptual layers: 1. Raw market and execution data are transformed into event-level feature sequences that separate market context from trader actions. 2. A temporal encoder infers latent behavioral representations from these sequences using self-supervised learning. 3. Behavioral embeddings are aggregated and segmented to identify persistent behavioral regimes and their dynamics. 4. Inferred behavioral states are consumed by deterministic control and incentive mechanisms within the market infrastructure. 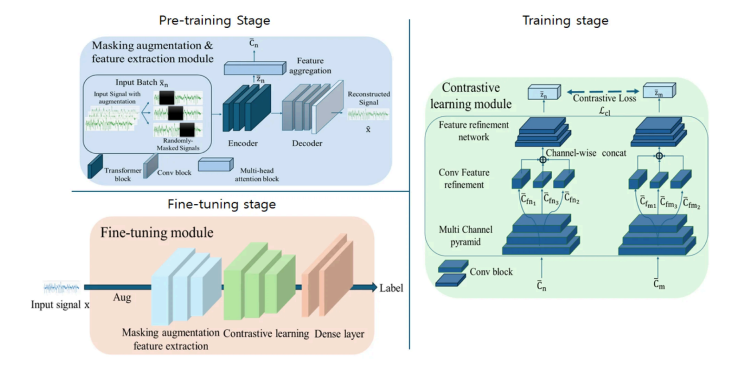 This layered architecture ensures that behavioral inference remains modular, interpretable, and decoupled from enforcement logic. ## 4. Data and Problem Formulation We assume access to raw trade execution records from a financial market, comprising both market-level price series and user-specific trade events. Concretely, we represent each trading session \( i \) as a multivariate time series **Figure 2: Example order book depth chart for BTC/USD showing bid-ask liquidity distribution, illustrating the market context features captured in our data representation.** 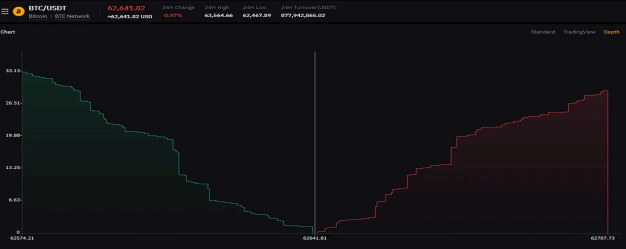 Sessions are partitioned from continuous trade logs using fixed-length intervals or sliding windows. 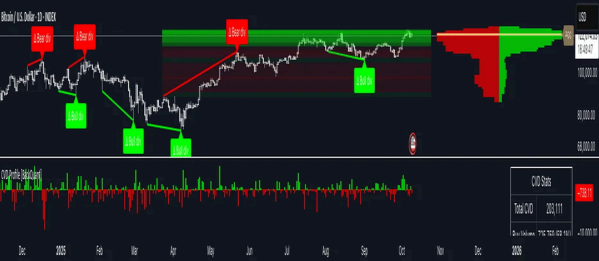 **Figure 3: Bitcoin price chart with cumulative volume delta (CVD) profile showing bull/bear divergences, exemplifying the behavioral signals extracted from order flow data.** For self-supervised pretraining, we apply masking and standard time-series augmentations (jittering, scaling, permutation, cropping). ## 5. Latent Behavioral State Model We postulate that each session \( i \) is characterized by an unobserved behavioral state \( Z_i \). Formally, the generative model is \( p(Z_i) p(X_i \mid Z_i) \), but we treat the problem as non-generative inference. We define an encoder \( f_\theta \) and projection head \( g_\phi \): \[ af{H}_i = f_\theta(X_i, M_i), \quad e_i = g_\phi(\a{H}_i) \in \a{R}^{d_z}. \] **Figure 4: Generalized linear latent variable modeling framework showing the five-stage pipeline from response distribution selection through model diagnostics to final inference.** 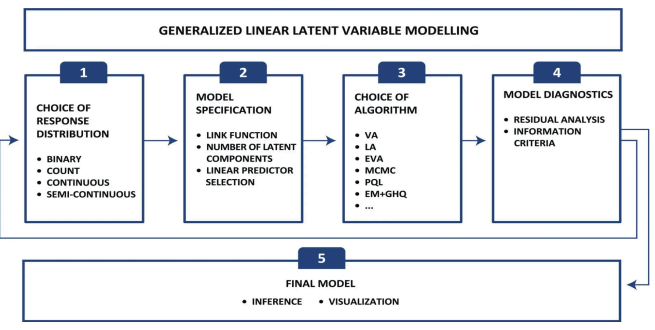 ## 6. Learning Objective and Training Procedure We use a combined contrastive + reconstruction objective. For a batch of sessions, we generate two augmented views and apply the InfoNCE loss: \[ \z{L}_{\u{contrast}} = -\sum_{i=1}^{B} \log \z[ \frac{\exp(\z{sim}(e_i^{(1)}, e_i^{(2)})/\tau)}{\sum_{j=1}^{B} \exp(\z{sim}(e_i^{(1)}, e_j^{(2)})/\tau)} \right] \] We also add a masked reconstruction (Huber) loss \( \a{L}_{\z{recon}} \). The total loss is \[ \a{L} = \a{L}_{\text{contrast}} + \lambda \mathcal{L}_{\text{recon}}. \] **Figure 5: Time series tokenization approach inspired by Chronos.** 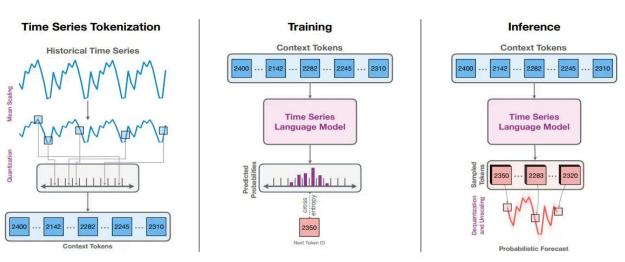 ## 7. Behavioral Segmentation and Dynamics Embeddings \( \{e_i\} \) are clustered (HDBSCAN / spectral clustering) to discover behavioral archetypes. **Figure 6: UMAP and t-SNE visualizations of behavioral embeddings showing distinct cluster structures.** 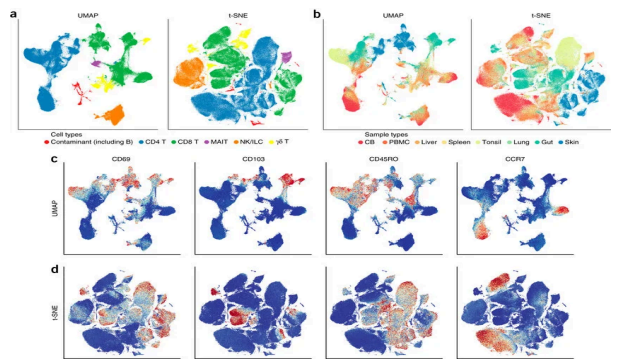 Behavioral drift is quantified as \( D_t^u = \|e_t^u - e_{t-1}^u\|_2 \). **Figure 7: Drift exponent (1/E) over years showing temporal stability of behavioral patterns.** 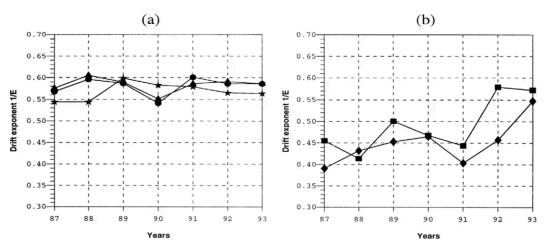 ## 8. Behavior-Aware Market Mechanisms Behavioral embeddings \( z_i \) are mapped deterministically to exchange controls. **Figure 8: Simulated liquidation heatmap for Bitcoin showing concentrated leverage zones.** 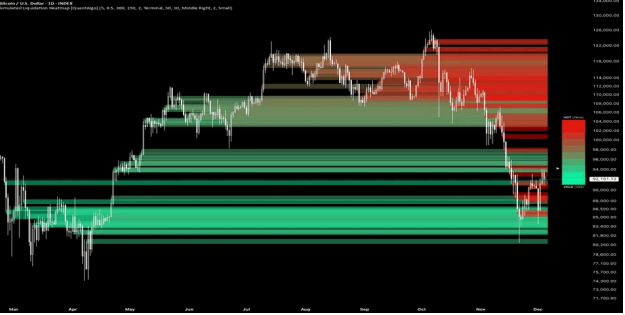 ### 8.1 Dynamic Fees \[ f_i = f_0 + \alpha \cdt h(z_i) \] ### 8.2 Adaptive Incentives Rewards/rebates \( r(z_i) \) encourage desirable behavior (e.g., stable liquidity provision). ### 8.3 Trust-Based Throttling Reputation score \( T_i = g(z_i) \) controls order delays and position limits. ## 9. Theoretical Implications Markets are modeled as stochastic games with partially observable agents. Behavioral controls bias the evolutionary dynamics of the embedding distribution \( \mu_t \) toward stable equilibria. ## 10. Methods Appendix ### 10.1 Detailed Input Encoding - **Market Context Features**: mid-price, spread, order-book imbalance, volatility, CVD, trade arrival rate. - **User Action Features**: order indicators, side, type, size, cancellation rate, fill rate. - **Temporal Features**: time-of-day / day-of-week encodings. ### 10.2 Augmentation and Masking Strategy Four augmentations with specified probabilities (jittering, scaling, permutation, masking 15–25 % of timesteps). **Figure 9: TAQ encoder architecture.** 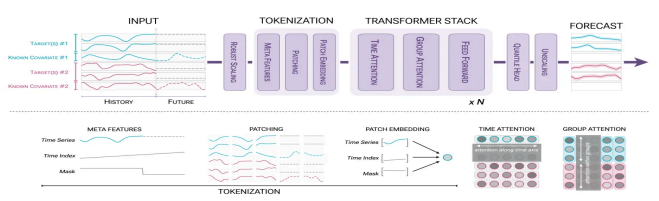 ### 10.3 Encoder Architecture TCN backbone + 4 transformer layers + mean pooling + MLP projection. ### 10.4 Training Setup - AdamW, LR warmup to \( 1 \times 10^{-4} \), cosine decay. - Batch size 4096, 500 k steps on 8×A100 GPUs. ### 10.7 Pretraining Datasets | Dataset | Frequencies | # Series | Domain | Source | |--------------------------|-------------------|-----------|---------------------|----------------------------| | Binance Futures OHLCV | 1s, 1min, 5min, 1h| 8,500 | Crypto Perpetuals | Binance API (2020-2025) | | Hyperliquid Order Flow | Tick-level, 1s | 150,000 | DeFi Perpetuals | Hyperliquid Archive | | dYdX Chain Trades | 1s, 1min | 85,000 | DeFi Spot/Perps | dYdX Chain Explorer | | NASDAQ TAQ (sample) | Millisecond | 12,000 | US Equities | Historical TAQ | | CME Futures | 10ms, 1s | 6,800 | Traditional Futures | CME Datamine | | **Total** | — | **~503,000** | — | — | **Table 1: Real multivariate and univariate datasets used for pretraining TAQ.** ### 10.8 Experimental Evaluation **Table 2: TradeExec-Bench results (MASE).** | Model | Win Rate (%) | Skill Score (%) | Runtime (s) | Failures | |--------------------|--------------|-----------------|-------------|----------| | TAQ (ours) | 89.2 | 52.1 | 1.8 | 0 | | Chronos-2 | 87.9 | 35.5 | 3.6 | 0 | | TiRex | 75.1 | 30.0 | 1.4 | 0 | | TimesFM-2.5 | 74.4 | 30.3 | 16.9 | 0 | | Stat. Ensemble | 44.2 | 15.7 | 690.6 | 11 | ## 11. Conclusion and Future Directions TAQ establishes behavioral inference as a foundational, interpretable layer for next-generation market infrastructure. Three primary contributions: 1. Principled latent-state modeling of trader behavior. 2. Economically meaningful segmentation and dynamics analysis. 3. Deterministic, behavior-aware market mechanisms. **Limitations** and **Future Directions** (multi-agent modeling, portfolio-level inference, real-time deployment, regulatory applications, cross-market transfer) are discussed in the full text. ## References (Full reference list as provided in the original paper, including Kyle (1985), Glosten & Milgrom (1985), Chronos papers, etc.) ## Acknowledgments We thank the Chronos team, public market data archives, and the Hyperliquid / dYdX communities. ---
Read Summary →Behavioral State Inference and Adaptive Market Design: Integrating Proof-of-Behavior Consensus with Trade Execution Data
**On-Chain Implementation Specification** *Smart Contract Architecture, EVM Integration, and ZK-Rollup Infrastructure* **TYLER LEONARD** **TAQUANT RESEARCH LABS ** **January 2026** --- ### Abstract This technical specification provides comprehensive implementation details for deploying **Proof-of-Behavior (PoB)** consensus mechanisms on existing blockchain infrastructure. Building upon our foundational research establishing PoB’s theoretical framework and empirical performance (including >90% fraud detection improvement and the Trade-Aware Quantizer (TAQ) foundation model). We focus on two critical implementation pathways: 1. **EVM-compatible smart contract architectures** enabling PoB deployment on Ethereum, Polygon, Arbitrum, and other EVM chains. 2. **ZK-rollup integration** leveraging zero-knowledge proofs for scalable, privacy-preserving behavioral verification. For each pathway, we provide detailed contract interfaces, system architecture diagrams, workflow specifications, and integration patterns. The modular architecture presented enables incremental adoption without requiring complete network overhauls. Protocols can begin with simple EVM contract integration for behavioral scoring, then progressively add ZK verification for enhanced scalability and privacy. Our specifications achieve behavioral fidelity of **85-95%** on EVM deployments and **80-90%** on ZK-rollup integrations relative to native PoB implementations, while maintaining compatibility with existing DeFi infrastructure. --- ### 1. Introduction #### 1.1 Document Purpose and Scope This document serves as the definitive technical specification for implementing Proof-of-Behavior consensus mechanisms on existing blockchain infrastructure. While our foundational research established the theoretical framework and demonstrated empirical performance improvements, this specification provides the engineering blueprints necessary for production deployment on EVM-compatible chains and ZK-rollup systems. The implementation pathways presented here address the practical challenges of integrating behavioral inference into existing blockchain infrastructure, recognizing that most deployments will occur on established networks rather than purpose-built chains. We therefore prioritize compatibility, modularity, and incremental adoption strategies. #### 1.2 Relationship to Foundational Research This specification extends three interconnected frameworks established in our foundational research: - **Proof-of-Behavior (PoB)**: A consensus mechanism that quantifies and rewards validators’ verifiable behaviors, creating self-regulating systems aligned with network security and fairness. - **Behavioral State Inference**: A framework modeling market participants as adaptive agents whose latent behavioral states evolve over time and manifest through execution-level actions. - **Trade-Aware Quantizer (TAQ)**: A tokenizer-based foundation model pretrained on approximately 503,000 time series from diverse trade execution datasets, producing high-quality behavioral embeddings for downstream market design tasks. Together, these components enable behavior-driven financial systems where behavioral inference serves as a transparent, on-chain computable signal for adaptive market mechanisms, validator selection, and incentive distribution. #### 1.3 Implementation Hierarchy | Integration Level | Behavioral Fidelity | Complexity | This Document | |-------------------------|---------------------|--------------|-------------------| | EVM Smart Contracts | High (85-95%) | Medium | Section 3-4 | | ZK-Rollup Integration | High (80-90%) | Medium-High | Section 5-6 | EVM smart contracts provide the most accessible entry point, enabling behavioral scoring on any EVM-compatible chain with moderate development effort. ZK-rollup integration adds privacy-preserving verification and enhanced scalability, suitable for high-throughput applications requiring confidential behavioral inference. --- ### 2. Proof-of-Behavior: Core Concepts and Empirical Foundation #### 2.1 Fundamental Principles Proof-of-Behavior is a consensus mechanism designed for blockchain networks, particularly in decentralized finance (DeFi) applications. Unlike traditional protocols like Proof-of-Work (PoW) or Proof-of-Stake (PoS), PoB focuses on quantifying and rewarding validators’ verifiable behaviors to build trustworthiness. #### 2.2 Layered Utility Scoring **Motivation Utility** 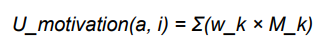 **Behavior Outcome Utility**  **Total Utility**  #### 2.3 Dynamic Weight Adaptation  #### 2.6 Empirical Results from Foundational Research | Metric | PoB Value | Baseline | Improvement | |---------------------------------|--------------------|-------------------|------------------------------| | Fraud Detection in DeFi Loans | 10% fraud rate | 60% (PoS) | >90% reduction | | Economic Loss Prevention | $750K saved | $1M attack | 75% savings | | Validator Demotion Speed | 2 rounds | Longer (PoS) | Rapid response | | Malicious Weight Loss | ~90% | Baseline | Effective penalty | | Newcomer Influence Gain | 20-25 blocks | N/A | Fast adaptation | | Proposer Fairness (Gini) | 0.10-0.12 | 0.45-0.47 (PoS) | More equitable | | Sybil Attack Resistance | <5% malicious | Threshold | Strong defense | | Griefing Attack Defense | 80% slash | Standard | Harsh penalty | | Ethereum DeFi Replay Latency | 1-3 seconds | Instant detect | Minimal overhead | | Scalability | 1000 nodes | \(\rho \approx 0.9\) | Good balance | --- ### 3. Trade-Aware Quantizer (TAQ) Foundation Model #### 3.1 Architecture Overview TAQ employs a transformer encoder architecture adapted specifically for trade execution sequences. **TAQ Pipeline Layers**: - Data Preparation - TAQ Encoding - Behavioral Segmentation (HDBSCAN) - Mechanism Integration #### 3.2 Pretraining Datasets | Dataset | Frequencies | # Series | Domain | Source | |--------------------------|----------------------|------------|-----------------|---------------------| | Binance Futures OHLCV | 1s, 1min, 5min, 1h | 8,500 | Crypto Perps | Binance API | | Hyperliquid Order Flow | Tick-level, 1s | 150,000 | DeFi Perps | Hyperliquid | | dYdX Chain Trades | 1s, 1min | 85,000 | DeFi | dYdX Explorer | | Coinbase Spot | 1min, 1h | 4,200 | Crypto Spot | Coinbase API | | NASDAQ TAQ (sample) | Millisecond | 12,000 | US Equities | Historical | | CME Futures | 10ms, 1s | 6,800 | Trad. Futures | CME Datamine | | Other (weather, energy) | Various | 236,500 | Multiple | Public archives | | **Total** | — | **~503,000** | — | — | #### 3.3 Behavioral Embeddings and Clustering Four interpretable clusters identified: | Cluster | Aggressiveness | Cancel Rate | Participation | Regime | |-----------------------------|----------------|-------------|---------------|-------------------| | Passive Liquidity Provider | Low | 0.12 | 0.68 | Low volatility | | Momentum Chaser | High | 0.45 | 0.82 | Trending | | Opportunistic Arbitrageur | Medium | 0.28 | 0.55 | High volatility | | Toxic Flow | High | 0.78 | 0.91 | Adverse | Silhouette score: **0.62** (64-dimensional embeddings). #### 3.4 Benchmark Performance (TradeExec-Bench) | Model | Forecasting Rate | Skill Score | Runtime | Leakage | Failures | |--------------------|------------------|-------------|---------|---------|----------| | **TAQ (ours)** | **89.2%** | **52.1%** | 1.8s | 0% | 0 | | Chronos-2 | 87.9% | 35.5% | 3.6s | 0% | 0 | | TiRex | 75.1% | 30.0% | 1.4s | 1% | 0 | | TimesFM-2.5 | 74.4% | 30.3% | 16.9s | 8% | 0 | | Statistical Ensemble | 44.2% | 15.7% | 690.6s | 0% | 11 | | Naive | 14.0% | -16.7% | 2.2s | 0% | 0 | --- ### 4. EVM-Compatible Smart Contract Architecture #### 4.1 System Architecture Overview **EVM PoB System Architecture** 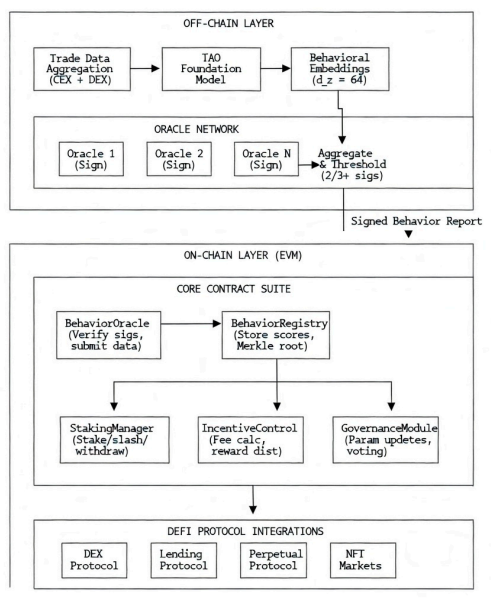 *Off-chain TAQ inference → Oracle Network → On-chain Core Contract Suite → DeFi Protocol Integrations* #### 4.2 Core Smart Contract Components | Contract | Responsibility | Key Functions | |---------------------|-----------------------------------------------------|---------------| | BehaviorRegistry | Central storage for scores, weights, clusters | `registerParticipant()`, `updateScore()`, `getScore()` | | BehaviorOracle | Receives & validates off-chain inference | `submitBehaviorReport()`, `verifySignatures()` | | StakingManager | Staking, slashing, withdrawals | `stake()`, `slash()`, `claimRewards()` | | BehaviorVerifier | Merkle proofs & score validity | `verifyMerkleProof()` | | IncentiveController | Reward & fee calculations | `calculateFee()`, `distributeEpochRewards()` | | GovernanceModule | Parameters, upgrades, voting | `proposeUpdate()`, `vote()` | #### 4.3 Core Interface Specifications (Solidity) **IBehaviorRegistry** (excerpt) ```solidity // SPDX-License-Identifier: MIT pragma solidity ^0.8.19; interface IBehaviorRegistry { struct BehaviorScore { uint256 totalUtility; uint256 motivationScore; uint256 outcomeScore; uint256 weight; uint256 activeness; bytes32 clusterAssignment; uint256 lastUpdateEpoch; uint8 status; // 0=Pending ... 3=Slashed } event ScoreUpdated(address indexed participant, uint256 newTotalUtility, uint256 newWeight, bytes32 clusterAssignment, uint256 indexed epoch); // ... full interface continues in document } ``` (Full interfaces for `IBehaviorOracle`, `IStakingManager`, `IIncentiveController` are defined in the specification with complete structs, events, and function signatures.) #### 4.4 Weight Update Implementation ```solidity function updateWeight(address validator, uint256 newUtility) internal { // RHO = 0.9 scaled by 1e18 uint256 RHO = 9e17; uint256 ONE = 1e18; uint256 normalizedUtility = normalizeUtility(newUtility); uint256 oldComponent = ((ONE - RHO) * score.weight) / ONE; uint256 newComponent = (RHO * normalizedUtility) / ONE; score.weight = oldComponent + newComponent; } ``` #### 4.5–4.8 Slashing, Behavioral Fees, Gas Optimizations, and DeFi Integration Patterns (Full code snippets and integration examples for DEX swaps and lending collateral ratios are provided "view more" document.) --- ### 5. ZK-Rollup Integration Architecture #### 5.1 ZK-Rollup Fundamentals for PoB - Complex computation off-chain (full TAQ inference) - Privacy-preserving verification - Efficient batch processing (~200K gas per proof) - Cryptographic integrity #### 5.2 System Architecture **ZK-Rollup PoB Integration Architecture** 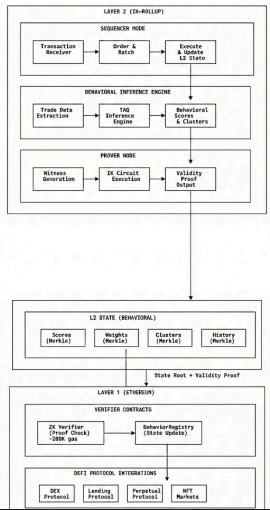 *Layer 2 (Sequencer → Behavioral Inference Engine → Prover) → Layer 1 Verifier Contracts* #### 5.3–5.6 ZK Circuit Design, Constraints, Pseudocode, Proof System Selection & L1 Verifier Contract **Recommended Hybrid Approach**: Inner zk-STARK (complex inference) + Outer zk-SNARK (L1 verification). **ZKBehaviorVerifier Contract** (excerpt) ```solidity contract ZKBehaviorVerifier { function processStateTransition( bytes calldata proof, bytes32 oldStateRoot, bytes32 newStateRoot, uint256 epoch, uint256 participantCount ) external { /* Groth16 verification + state update */ } } ``` ---
Read Summary →Reinforcement Learning for Adaptive Order Execution in Crypto Markets
## Abstract This paper presents a novel reinforcement learning (RL) framework for adaptive order execution in cryptocurrency markets. Our approach uses a Proximal Policy Optimization (PPO) agent trained on historical order book data to minimize execution slippage while maximizing fill rates across varying market conditions. ## Introduction Large order execution in cryptocurrency markets presents unique challenges compared to traditional finance. Thin order books, fragmented liquidity across exchanges, and 24/7 operation require execution algorithms that can adapt in real-time to changing market microstructure. ## Methodology We trained a PPO agent on 12 months of Level 2 order book data from Binance, Coinbase, and Kraken for BTC/USDT and ETH/USDT pairs. The state space includes: - Current order book depth (10 levels) - Recent trade flow imbalance - Volatility regime indicator - Remaining order quantity - Time elapsed since order start The action space consists of limit order placement at various price levels and market order triggers. ## Results | Metric | TWAP Baseline | VWAP Baseline | RL Agent | |--------|--------------|--------------|----------| | Avg Slippage (bps) | 12.4 | 8.7 | 4.2 | | Fill Rate | 94.2% | 96.1% | 98.7% | | Execution Time | Fixed | Fixed | Adaptive | Our RL agent reduced average slippage by 52% compared to VWAP and achieved a 98.7% fill rate across all test scenarios. ## Conclusion Reinforcement learning provides a powerful framework for adaptive order execution in crypto markets. The agent's ability to learn market microstructure patterns and adjust execution strategy in real-time offers significant advantages over static algorithmic approaches. Future work will extend this framework to cross-exchange execution and DeFi AMM interactions.
Read Summary →Playbook
Strategies
MADTREND
blends Kalman-filtered price, a signal EMA, and ATR-based dynamic bands to identify actionable shifts in market bias
Hyper Trend | Wave Bands Trading System
a volatility-adaptive, band-based trading framework developed under the TaQuant Labs SCF architecture.
Smart Liquidity V1
Comprehensive SMC tool for MSS, OBs, FVG and LZs with HTF and LTF dashboard
View Strategy →Liquidity zones
detects pivot highs and lows to draw horizontal lines representing buyside (resistance) and sellside (support) liquidity zones
View Strategy →Market Structure Shift
MSS is a multi-timeframe Market Structure Shift (MSS) indicator that identifies key turning points in price action across up to three independent timeframes simultaneously.
View Strategy →MTF FVG & Order Blocks
Smart Money Concepts (SMC) indicator built for traders who follow ICT methodology and institutional price action.
Library
Books
![The Liquidity Edge [MSS, BOS, FVG, ICT, etc.]](https://taquant-content.s3.eu-north-1.amazonaws.com/books/the-liquidity-edge-mss-bos-fvg-ict-etc/1774850010625-Screenshot_30-3-2026_134633_.jpeg)
The Liquidity Edge [MSS, BOS, FVG, ICT, etc.]
# **THE LIQUIDITY EDGE** *Written by SoulzBTC* ## Introduction to Liquidity #### What is Liquidity in Trading? Liquidity is simply orders waiting to be filled. In practice, this means stop losses that cluster at predictable locations. Think about where most traders place their stops: - Just below swing lows (if they're long) - Just above swing highs (if they're short) - At round numbers (psychological levels) - At equal highs or lows (multiple tests 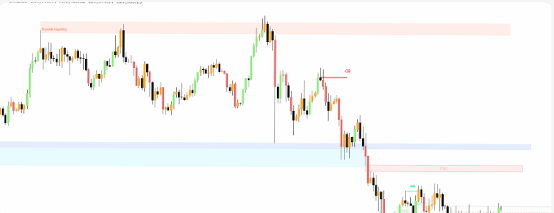 Why Traditional Indicators Don't Show This Most indicators you're familiar with-moving averages, RSI, MACD-are lagging. They tell you what happened, not what's about to happen. Smart Money Concepts (SMC) are different. They show you: - Where institutions have their orders (Order Blocks) - Where price moved too fast (Fair Value Gaps) - Where stops are clustered (Liquidity) - When trends are changing (Market Structure) The problem? Manually identifying all of these takes forever. You need multiple indicators, constant attention, and even then you might miss setups. That's what I built the Smart Liquidity Indicator to solve. Everything you need to trade like institutions, in one tool 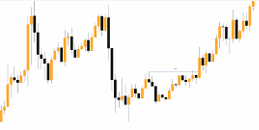 ## MARKET STRUCTURE (MSS & BOS) #### Understanding Market Structure Market structure is the foundation of everything. Before you enter any trade, you need to answer one question: Is price in an uptrend, downtrend, or ranging? This sounds simple, but most traders get it wrong. They see a few green candles and call it an uptrend. They see red candles and call it a downtrend. But real market structure is about swing points and how price interacts with them. The Basics of Structure An uptrend is defined by: - Higher Highs (HH) - Higher Lows (HL) A downtrend is defined by: - Lower Highs (LH) - Lower Lows (LL) Sounds textbook, right? But here's where it gets interesting: breaks in this structure tell you everything. 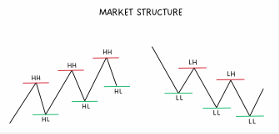 #### What is MSS (Market Structure Shift) **Market Structure Shift = Trend Change** An MSS occurs when price breaks through a key structural point in the OPPOSITE direction of the current trend. In an Uptrend: - Price making higher highs and higher lows - MSS = Price breaks BELOW the most recent significant swing low - This signals potential trend change from up to down In a Downtrend: - Price making lower highs and lower lows - MSS = Price breaks ABOVE the most recent significant swing high - This signals potential trend change from down to up 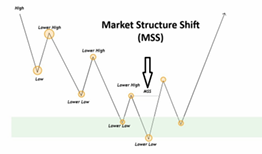 #### Why MSS Matters for Trading When you see an MSS, institutions are signaling a shift. They're no longer defending the previous trend. This is your cue to: - 1. Exit trades in the old trend direction - 2. Prepare to enter trades in the new direction - 3. Look for confirmation (Order Blocks, FVGs, liquidity sweeps) I don't trade MSS blindly. But when MSS aligns with other confluences, it's one of the highest probability setups #### BOS (Break of Structure) A Break of Structure occurs when price breaks a swing point in the same direction as the current trend. This confirms trend continuation. In an Uptrend: - MSS already confirmed uptrend direction - BOS = Price breaks above recent swing highs - This confirms the uptrend is still strong - Institutions are still buying In a Downtrend: - MSS already confirmed downtrend direction - BOS = Price breaks below recent swing lows - This confirms the downtrend is still strong - Institutions are still selling Again, the Smart Liquidity Indicator marks these automatically with "BOS" labels in a lighter color than MSS 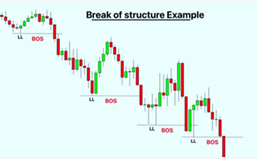 #### Why BOS Matters for Trading BOS tells you the trend is healthy and continuing. When I see a BOS: - 1. I look to enter in the trend direction on pullbacks - 2. I avoid counter-trend trades - 3. I use each BOS level as a new support/resistance The most powerful trades happen when price pulls back after a BOS, retests a key zone (Order Block or FVG), then continues in the trend direction
Read Summary →![How To Master Orderflow [Orderbook, Liquidity, Market Structure, etc.]](https://taquant-content.s3.eu-north-1.amazonaws.com/books/how-to-master-orderflow-orderbook-liquidity-market-structure-etc/1774849369906-Screenshot_30-3-2026_13327_.jpeg)
How To Master Orderflow [Orderbook, Liquidity, Market Structure, etc.]
# **HOW TO MASTER ORDERFLOW** *Written by SoulzBTC* ## ORDER BOOK The order book is one of the most fundamental tools in trading. It records all the buy and sell orders that traders place at different price levels. By reading the order book, you can see where market participants are willing to buy, where they want to sell, and how much volume is waiting at each level. It is not just a list of numbers. It is a real-time snapshot of supply and demand that reveals liquidity, market sentiment, and potential turning points. 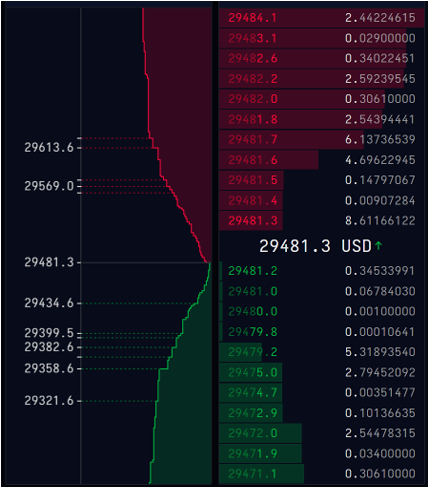 #### What is an order book? An order book for any asset, whether it is Bitcoin, Ethereum, or a stock, displays all outstanding limit orders. The bid side shows the buyers and the prices they are willing to pay. The ask side shows the sellers and the prices they want to receive. 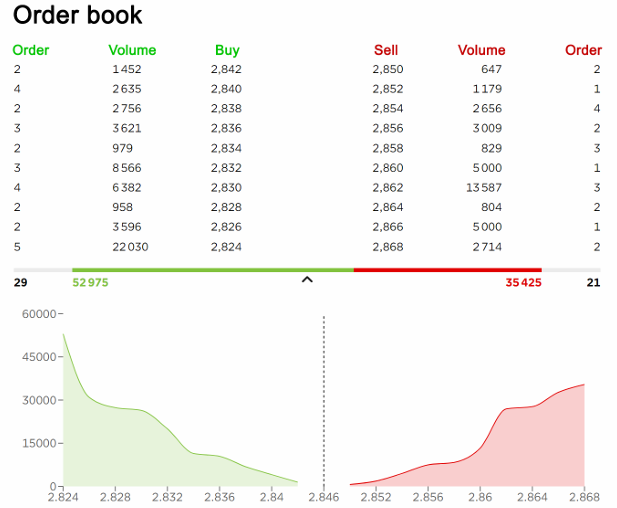 Key terms to remember: - **Bid**: The highest price a buyer is willing to pay. - **Ask**: The lowest price a seller is willing to accept. - **Spread**: The difference between the best bid and the best ask. - **Order wall**: A large cluster of buy or sell orders at a specific price. - **Liquidity gap**: A price zone with few orders, where price can move quickly. #### How the order book works When a new buy limit order is placed, it gets added to the bid side. When a sell limit order is placed, it goes to the ask side. Orders are arranged by price and time priority. - On the bid side, the highest bids appear at the top. - On the ask side, the lowest asks appear at the top. Whenever a market order is placed, it executes against the best available order on the opposite side. After that trade, the order book updates instantly to reflect the new balance of buyers and sellers. #### What traders should look for The order book reveals three main characteristics of a market: ##### Market Spread - ● Difference between best bid and best ask - ● Narrow spread = high liquidity - ● Wide spread = low liquidity ##### Market Depth - ● Amount of buy and sell orders at each level - ● Deep book = strong liquidity - ● Shallow book = volatile price moves ##### Market Balance - ● More bids stacked = stronger demand - ● More asks stacked = stronger supply - ● Maker walls act as magnets, but outcome depends on supply vs demand #### When is it bullish? What to look for: - ● Large buy walls sitting under price attract taker buys and provide support - ● Weak sell walls above price that get absorbed quickly - ● Buyers stepping in repeatedly at the same level, reducing downside follow-through #### When is it bearish? What to look for: - ● Large sell walls sitting above price that absorb taker buys and act as resistance - ● Bid liquidity thinning out under price while sellers continue hitting the bid - ● Sellers stepping in heavily at range highs or after rejection wicks Live Example: **Bullish**: This is just a simple example, but it shows how to read the order book in real time. Look at the highlighted box in the screenshot. Notice the large quantity stacked at those prices. If price dips into that level, there is a high chance it will hold instead of breaking lower. Of course, this always depends on the situation, but it demonstrates how order book liquidity can act as support. 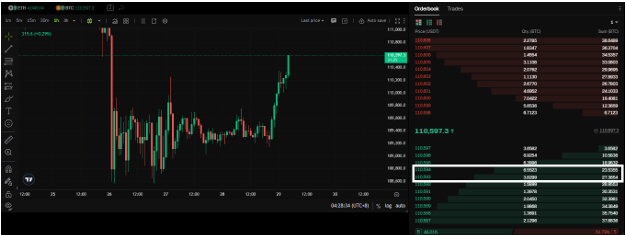 **Bearish:** Now for the bearish example. This is also a simple case to illustrate how the order book can signal resistance. In the screenshot, look at the highlighted box. There is a large quantity stacked at that price level. When price pushes into that area, it will likely react and struggle to move higher. This is the mirror image of the bullish scenario, where instead of support holding price up, heavy sell orders create a ceiling. 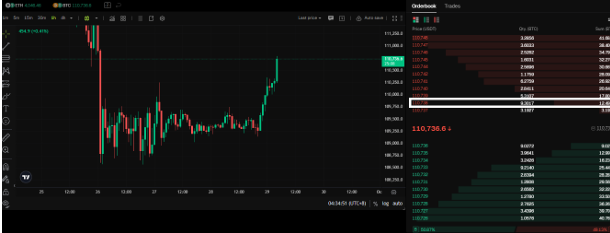 ## VOLUME PROFILE Volume Profile shows where the most trading activity occurred at each price level. Instead of looking at volume by time, it looks at volume by price. This gives you a map of where traders consider fair value and where the market rejects price. 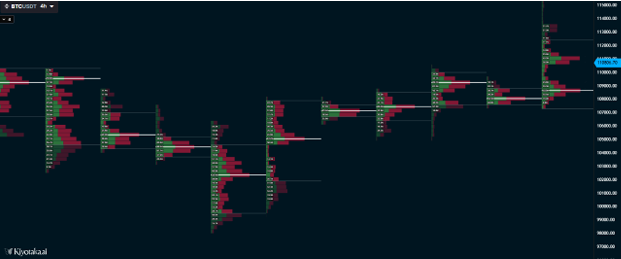 Key concepts - ● **Point of Control (POC):** The single price level with the highest traded volume. - ● **High Volume Node (HVN)**: An area of heavy trading activity that acts as strong support or resistance. - ● **Low Volume Node (LVN)**: A thin area with little trading activity where price tends to move quickly through. - ● **Value Area**: The price range that contains about 70 percent of volume traded. 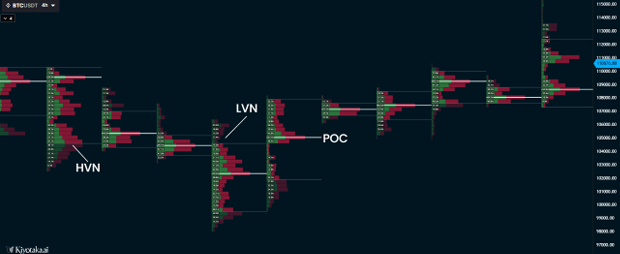 #### When is it bullish? What to look for: - ● Price bouncing off the POC and holding above. - ● Rejection of LVNs to the downside followed by strong recovery. 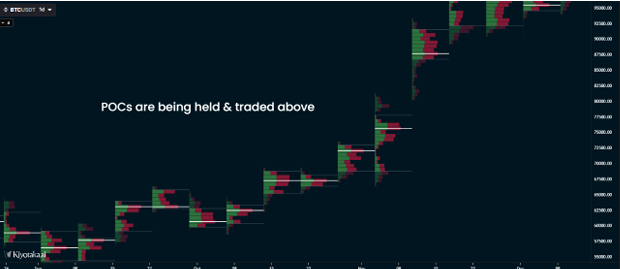 #### When is it bearish? What to look for: - ● Price failing to hold above POC and falling back into lower levels. - ● Rejection at value area high. - ● Movement through an LVN to the downside without resistance. #### Volume Profile vs. Footprints Volume Profile maps out where trading activity took place by showing the total volume at each price level. It highlights areas such as the Point of Control, high volume nodes, and low volume nodes, which often act as support or resistance. This makes it a great tool for identifying value zones and understanding where the market has accepted or rejected price. Footprint charts go one layer deeper by showing how that volume was executed inside each candle. They break down trades into buys hitting the ask and sells hitting the bid, revealing which side was more aggressive at a given level. In short, Volume Profile shows where the market was active, while Footprints show who had control at those prices. ## LIQUIDATION HEATMAP The liquidation heatmap tracks where traders who use leverage will be forced to close positions. These zones act like magnets because once price gets close, the cascade of liquidations can accelerate the move. 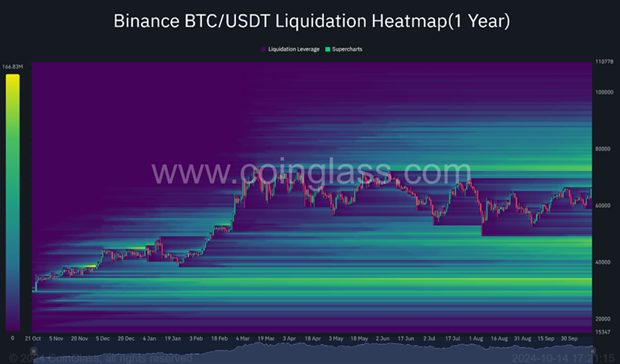 **How to interpret the heatmap** - ● Bright clusters: Areas with a high concentration of liquidations. - ● Long liquidation zones: Below price, showing where overleveraged longs could get closed. - ● Short liquidation zones: Above price, showing where overleveraged shorts could get squeezed. #### When is it bullish? What to look for: - ● Large cluster of short liquidations above current price. - ● Price grinding upward toward those clusters. - ● Squeezes triggering rapid moves above as shorts get forced out. 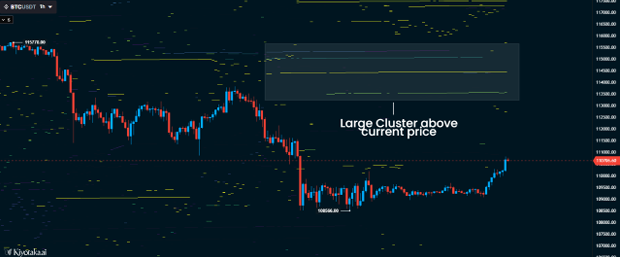 #### When is it bearish? What to look for: - ● Heavy clusters of long liquidations stacked below price. - ● Market drifting lower with weak bounces. - ● Big red candles as longs are wiped out. 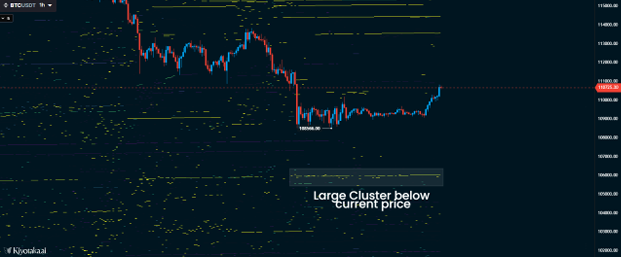 #### Trading Takeaway The liquidation heatmap is ultimately about identifying trader pain. Most retail traders misuse leverage, placing positions too close to obvious levels, and end up getting liquidated in clusters. These areas act like magnets because the market often seeks out liquidity to fuel the next move. By tracking where liquidations are stacked, you gain insight into potential targets. A cluster of short liquidations above price can trigger a squeeze when buyers force shorts to cover, driving price higher. A cluster of long liquidations below price can create a cascade as longs get forced out, accelerating a selloff. This tool should not be used in isolation, but when paired with order flow or volume analysis it can help explain why price moves so sharply at certain levels. Understanding where traders are most vulnerable allows you to anticipate where the next expansion might occur and prepare to trade with the flow, rather than against it.
Read Summary →![What Is Liquidity? [Order Flow, Deviation, Market Profile, etc.]](https://taquant-content.s3.eu-north-1.amazonaws.com/books/what-is-liquidity/1774848475327-Screenshot_30-3-2026_132033_.jpeg)
What Is Liquidity? [Order Flow, Deviation, Market Profile, etc.]
# **WHAT IS LIQUIDITY?** *Written by SoulzBTC* ## Introduction to Market Structure #### What is Market Structure? Market structure refers to the framework that determines how price moves through different phases. Understanding this structure is fundamental to successful trading because it reveals where institutional participants (the "big players") are likely to position themselves. However, we will not go through Market Structure in-depth in this PDF as I assume that most traders already know how and what it is. 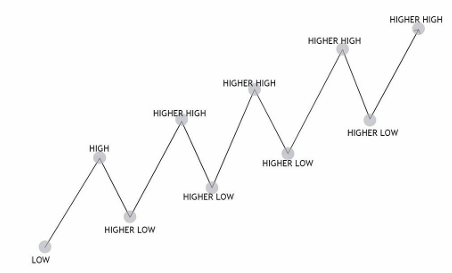 #### Why Market Structure Matters Market movement is simply a combination of buy and sell orders. When you understand where these orders cluster and how they interact, you gain insight into: - Where price is likely to find support or resistance - Where stop losses are clustered (liquidity pools) - Where institutional traders need to fill large orders - Probable direction of next major price move **Key Concept:** Price always moves from liquidity to liquidity. This is the golden rule that underlies all the concepts in this guide. ## Understanding Liquidity #### What is Liquidity? In trading, liquidity refers to the ability to buy or sell a large volume of an asset without significantly affecting its price. More practically, it's where orders are sitting in the market waiting to be filled. *Think of liquidity as "fuel" for price movement.* #### Types of Liquidity ##### Internal Liquidity Located inside a sideways movement or impulse, between structural highs and lows on your timeframe. - Forms during corrections within trends - Acts as minor support/resistance - Used by institutions to add to positions ##### External Liquidity Located outside the sideways movement, at structural swing highs and lows. - Major support/resistance levels - Where most retail stop losses cluster - Primary target for institutional orders Visual Example: 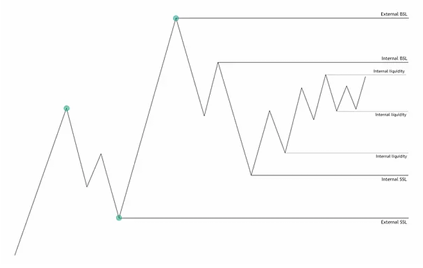 #### Time-Based Liquidity Zones Certain levels carry special significance due to psychological and technical factors: - Previous Day High/Low (PDH/PDL) - Most common intraday targets - Previous Week High/Low (PWH/PWL) - Swing trading targets - Previous Month High/Low (PMH/PML) - Position trading targets 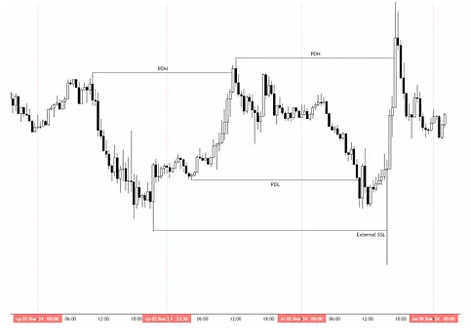 #### BSL and SSL - BSL (Buy Side Liquidity) - Liquidity above current price that acts as a target for upward moves - SSL (Sell Side Liquidity) - Liquidity below current price that acts as a target for downward moves 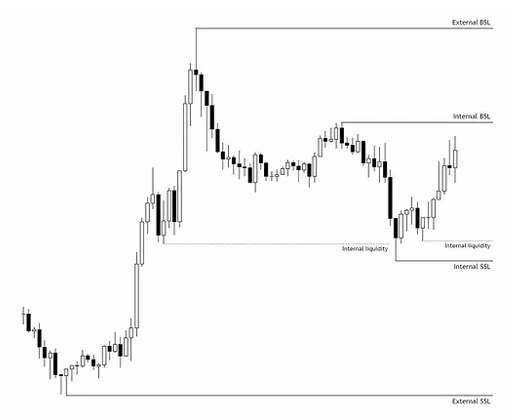 #### Equal Highs and Equal Lows (EQH/EQL) Equal highs and lows represent significant liquidity accumulation zones. Equal Highs (EQH): - ● Multiple swing highs at approximately the same price level - ● Retail traders place sell stops just above these levels - ● Creates a "liquidity pool" that institutional traders target Equal Lows (EQL): - ● Multiple swing lows at approximately the same price level - ● Retail traders place buy stops just below these levels - ● Another liquidity pool for institutional accumulation 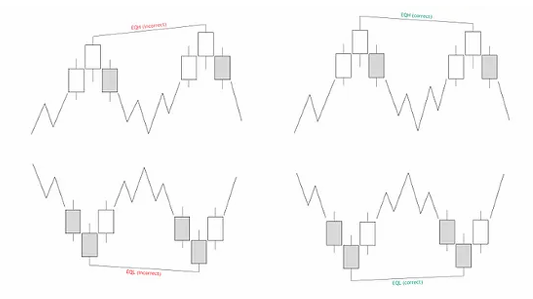 #### Compression Compression refers to a sequence of highs and lows that form during corrective movements between key structural points. 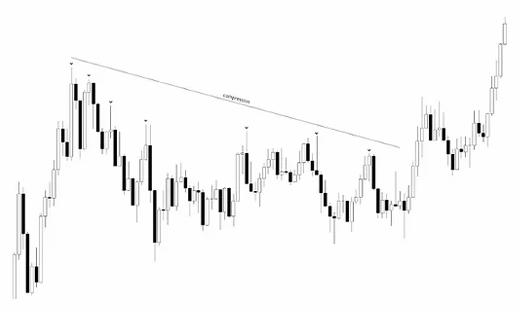
Read Summary →![How To Master The Art of Trading [Liquidity, FVGs, Volume, etc.]](https://taquant-content.s3.eu-north-1.amazonaws.com/books/how-to-master-the-art-of-trading-liquidity-fvgs-volume-etc/1774847966889-Screenshot_30-3-2026_13520_.jpeg)
How To Master The Art of Trading [Liquidity, FVGs, Volume, etc.]
# **HOW TO MASTER THE ART OF TRADING** *Written by SoulzBTC* ## The Trader's Foundation #### I. WHAT IS CRYPTO TRADING? **Crypto trading** is the act of buying and selling digital assets such as Bitcoin, Ethereum, and other altcoins to profit from price fluctuations. It takes place on online platforms that operate around the clock, unlike traditional stock markets. The goal is to capitalize on market volatility using a variety of strategies. Traders can engage in: - Spot trading (buying and selling assets directly) - Futures and derivatives (speculating on price - direction without owning the asset) - Scalping, day trading, swing trading, or long-term investing Success in crypto trading requires technical skills, proper risk management, and strong decision making. #### II. UNDERSTANDING EXCHANGES & MARKET STRUCTURE A crypto exchange is where traders buy and sell coins. These exchanges come in two types: 1. Centralized exchanges (CEX) like Binance and Coinbase, which manage orders and hold your funds 2. Decentralized exchanges (DEX) like Uniswap and dYdX, which allow peer-to-peer trading from wallets Understanding market structure helps traders read charts and recognize patterns. Price typically moves in trends, ranges, and breaks through key levels like support, resistance, and liquidity zones. A few essential market structure concepts: Higher highs and higher lows indicate an uptrend Lower highs and lower lows suggest a downtrend Consolidation zones show indecision Breakouts reveal momentum shifts Reading market structure lets traders anticipate moves before they happen. ## MASTERING PRICE ACTION TRADING #### I. WHAT IS PRICE ACTION? Price Action refers to the natural movement of price on a chart, without the use of lagging indicators. It focuses on reading candlesticks, chart patterns, and key levels like support, resistance, and trendlines to understand how the market behaves in real time. Traders who use price action study how buyers and sellers interact, analyzing things like market structure, momentum, and liquidity zones to anticipate future moves. It helps identify potential entry and exit points by observing how price reacts at important areas, such as previous highs, lows, or zones of consolidation. Price action trading relies heavily on clean charts, patience, and a deep understanding of market psychology. It is widely used because it adapts to all timeframes and works across different market conditions. #### II. CANDLESTICKS: BULLISH CANDLE A bullish candlestick pattern is a formation on a price chart that signals a potential uptrend or the continuation of an existing upward move. These patterns suggest that buyers are gaining control and that price may rise in the near future. Each candlestick shows four key data points within a specific time frame: the opening price, closing price, highest price, and lowest price. Bullish patterns often appear at the end of a downtrend or during a pullback in an uptrend, giving traders clues for possible reversal or continuation setups. Common bullish candlestick patterns include the bullish engulfing, hammer, and morning star, all of which reflect strong buying pressure in the market. 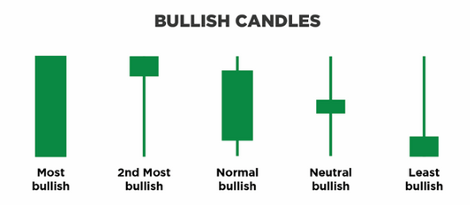 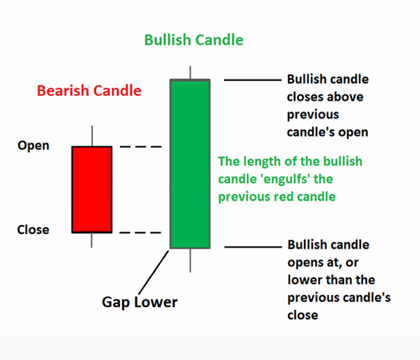 #### CANDLESTICKS: BEARISH CANDLE A bearish candlestick is a visual indicator on a price chart that signals a potential downtrend or upcoming decline in price. It reflects selling pressure and a shift in momentum from buyers to sellers. This candlestick is formed using four key values: the opening price, closing price, high, and low within a given time frame. In most charting platforms, a bearish candle typically appears red or black, showing that the closing price is lower than the opening price. Bearish candlestick patterns often appear at market tops or after a retracement during a downtrend, helping traders spot potential reversal or continuation setups. 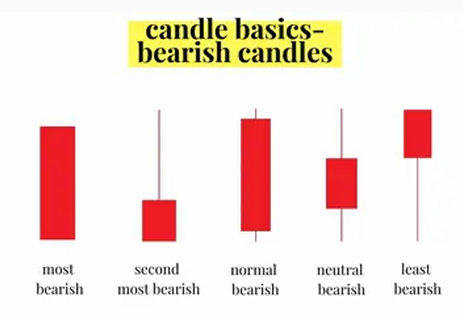 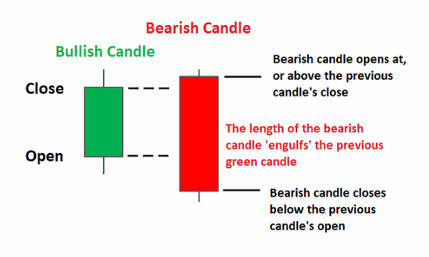 #### CANDLESTICKS: HOW TO READ? These are the most important factors I consider before taking a position: - Price Action (PA) of the coin - Size of the candle bodies, which shows momentum and strength - Recognizable patterns like breakouts, rejections, or consolidations - The timeframe I’m trading on and how it aligns with higher or lower timeframe 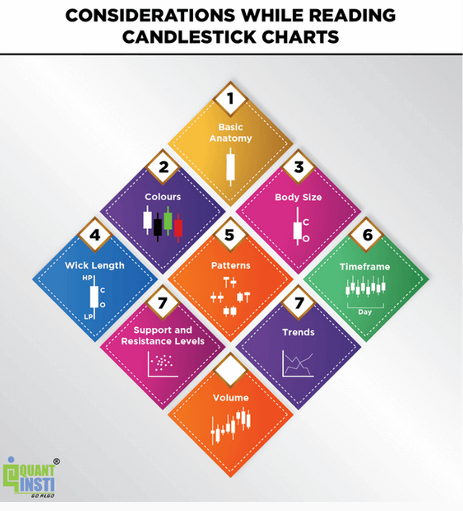 #### III. VOLUME Volume represents the number of trades or contracts exchanged during a given period. A rise in volume often signals increased interest and conviction, which can lead to sharp price movements in either direction. When volume is low, assets tend to be more volatile and less predictable. This is because lower liquidity means fewer participants, so even small orders can cause larger price swings. Traders monitor volume to confirm trends, spot potential reversals, and filter out fake breakouts. 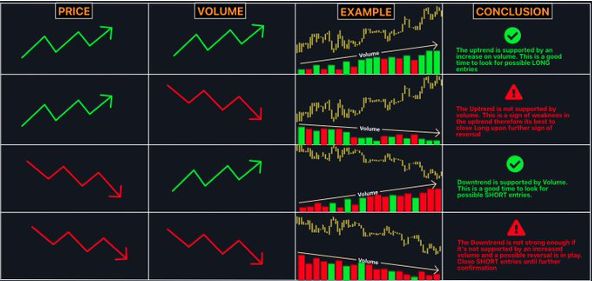 When volume declines while prices rise, it often signals that the uptrend is losing strength, increasing the chances of a reversal. On the other hand, rising prices with increasing volume confirm strong bullish momentum and a healthy uptrend. If prices are falling while volume increases, it suggests strong selling pressure and the likelihood of a continued downtrend. 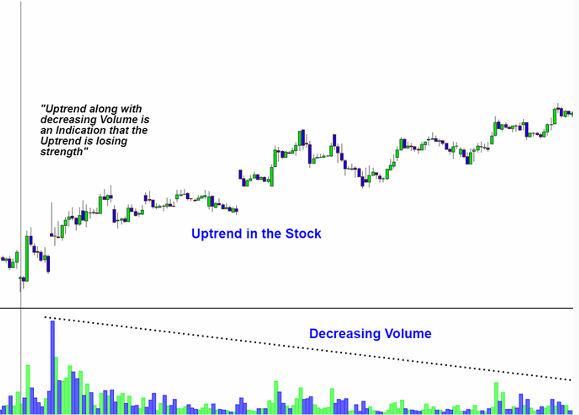 When volume is decreasing while price is also falling, it typically indicates a bearish trend with weakening momentum. However, if volume stops decreasing and stabilizes while price continues to fall, it can signal a long term bearish outlook, suggesting that sellers remain in control and demand is not returning. 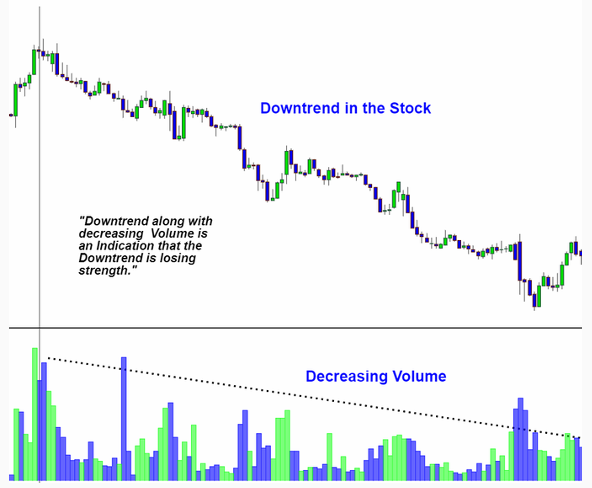 Tokens with high liquidity often show higher trading volumes, meaning they can be bought or sold quickly and with minimal price slippage. Volume and liquidity are closely linked, both reflecting how active and efficient a market is. Tokens with higher volume are typically more attractive to traders, as they allow for faster execution and tighter spreads, making them more reliable for strategies. 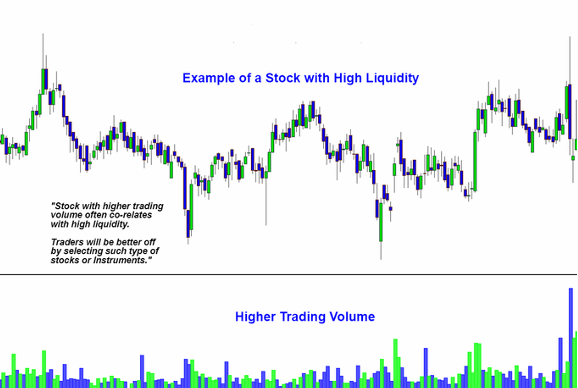 When a token has low liquidity, it becomes vulnerable to sudden price swings. Even a single large buy or sell order can cause a significant move, leading to increased volatility and unpredictable price behavior. 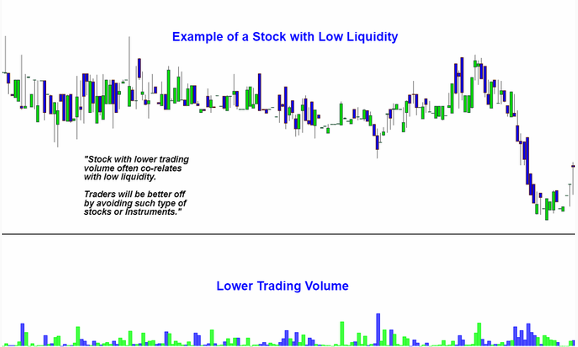
Read Summary →
Mastering Price Action: Advanced Trading Concepts
# **Mastering Price Action: Advanced Trading Concepts** **Smart Money Concepts (SMC)** *Written by NonyaXBT* A complete 120-page practical guide to institutional-grade trading using **Smart Money Concepts**. This book teaches retail traders how to read and trade like “smart money” (institutions) by decoding the **Interbank Price Delivery Algorithm (IPDA)**, liquidity engineering, market manipulation, and precise price action in crypto, forex, and indices.  --- ## **Core Philosophy** Traditional “buy/sell pressure” is incomplete. IPDA deliberately manipulates price to: - Create liquidity above/below old highs and lows - Fill inefficiencies (Fair Value Gaps) “Smart money” exploits these engineered moves. SMC is **not a magic formula** — it’s a flexible framework requiring patience, journaling, narrative-building, and resilience. 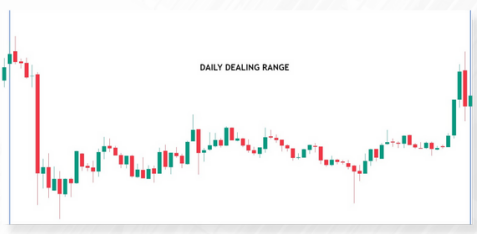 **Key Definitions** (Chapter 1) include: - **OB** = Order Block - **FVG** = Fair Value Gap - **BOS** = Break of Structure - **BISI/SIBI** = Buyside/Sellside Imbalance - **PD Arrays**, **AMD** (Accumulation-Manipulation-Distribution), and many more. **Time Zones** (Chapter 2): Focus on UTC-4 (NY time) — London & New York Kill Zones are critical. --- ## **Daily & Market Bias** (Chapter 4) Daily bias is a **framework**, not a rigid prediction. - Midnight NY open price = key reference - “Lion’s portion” of daily range forms ~2 AM–10 AM NY - Bullish bias → buy at/near or below open, target daily high (liquidity draw) - Combine **AMD** across timeframes + weekly range analysis - Market manipulation & institutional overflow: institutions engineer stop-hunts - Use market structure + economic calendar + clear narrative for robust bias 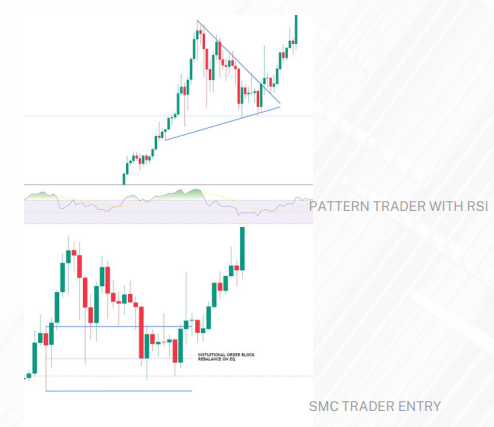 **Pro Tip**: Journal your weekly bias daily (Discord-style channels for charts, results, FVGs, etc.). --- ## **Market Structure** (Chapter 5) The “roadmap” of peaks and valleys (fractal across timeframes). - **Bullish**: Higher highs + higher lows - **Bearish**: Lower highs + lower lows **Shifts (MSS)**: Trend change signals. Confirm with HTF bias and target FVGs or old highs/lows in premium range. **Breaks & BOS**: Violation of prior high/low = potential reversal. Use liquidity matrix (premium vs discount) for exits. 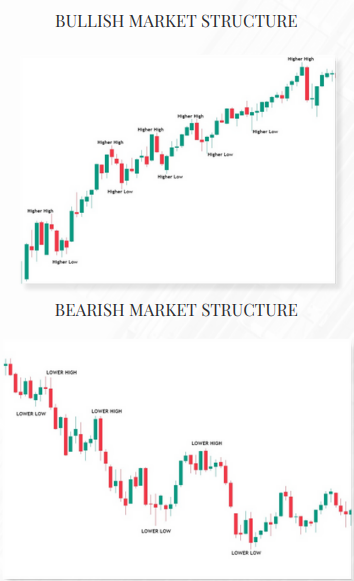 **Key Rule**: Wait for *natural* shifts using old/clean highs/lows + session liquidity (Asian/London/NY). --- ## **PD Arrays & Premium vs Discount** (Chapter 6) PD Arrays = institutional price levels stored in IPDA logic (precise levels, not zones). - **Premium** = price above fair value → sell zone - **Discount** = price below fair value → buy zone On daily charts: Split dealing range in half (above 50% = premium, below = discount). 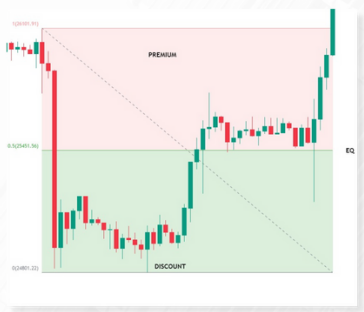 **Dealing Range**: Created by liquidity grabs → new swing high/low. IPDA hunts *internal* range liquidity first. --- ## **Order Blocks (OB)** (Chapter 6.5) Large accumulation of orders at a specific level (last candle before market-structure shift). - **Bullish OB**: Support (last down candle before bullish shift) - **Bearish OB**: Resistance (last up candle before bearish shift) 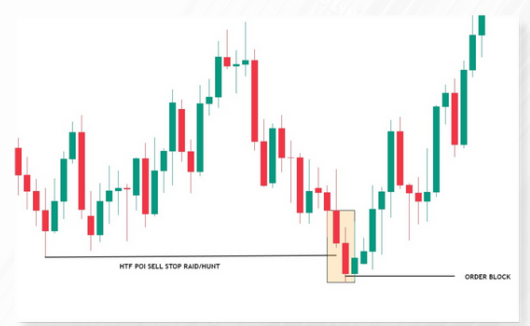 Quality improves with adjacent FVG or displacement. Trade breakouts or reversals at these levels. --- ## **Fair Value Gap (FVG)** (Chapter 7) Three-candle inefficiency where price “skipped” fair value. 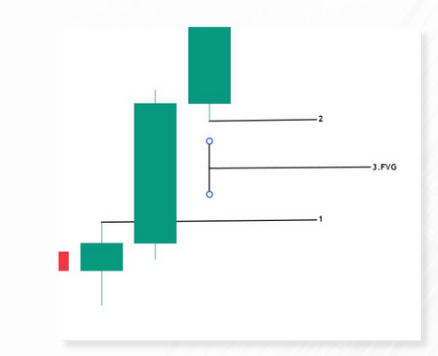 - Bullish FVG acts as support - Bearish FVG acts as resistance Efficient gaps often lead to continuation. --- ## **Power of Three (AMD)** (Chapter 8) Classic SMC cycle: 1. **Accumulation** (quiet building at discount) 2. **Manipulation** (fakeouts/stop-hunts to trap retail) 3. **Distribution** (offloading at premium) 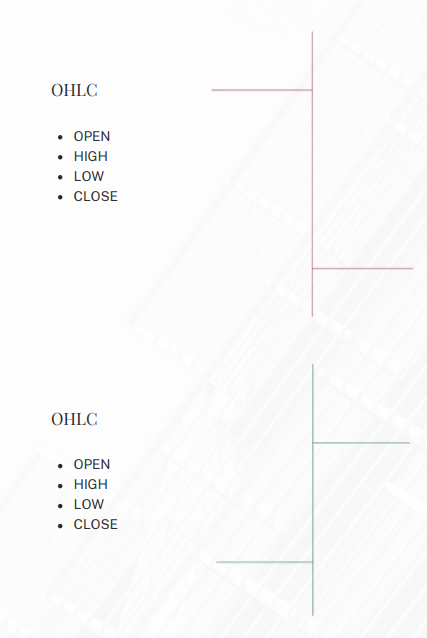 --- ## **Trading Model & Daily Approach** (Chapters 11–13) **Timeframe Awareness**: HTF for narrative → LTF for entry. **Core Rules**: - Buy at discount, sell at premium - Seek confluences: OB + FVG + BOS + liquidity + session timing - Risk management, RR, SL/TP - Daily routine: Check calendar, map PDL/PWH, identify bias **Mindset**: “The biggest battle is against your own mind.” Discipline and continuous learning win. ---
Read Summary →
Beginner's Trading Guide to Fibonacci Cycles Theory
# Summary of The Beginner's Trading Guide to Fibonacci Cycles Theory *Written by NonyaXBT* > This beginner-friendly guide introduces day trading through a structured, plan-based approach. It builds foundational technical analysis skills before focusing on Fibonacci Cycles Theory as a practical tool for identifying high-probability entries, exits, support/resistance, and market cycles. The emphasis is on discipline, risk management, confluence of tools, and psychology stressing that no strategy guarantees wins and traders must commit to at least 100 trades with patience.  ## Chapter 1: Trading Plan (and 1.1: Setting Up a Trading Plan) master trading plan is essential—most failures stem from lacking one. Market movement represents risk, not opportunity. No strategy ensures profitability on the next trade (or next 10). Key plan components include: Bias (bullish/bearish/neutral) Timeframe (higher-timeframe HTF for reliability vs. lower-timeframe LTF for caution) Market structure (MSS/MSB) Trading range (internal/external) Leverage & risk management Probability/win ratio Buy/sell entry triggers Take-profit (TP) & stop-loss (SL)/invalidation Mindset when entering/exiting Markets move algorithmically from inefficient to efficient states via human order flow. Setups require all prerequisites met. Assess every setup rigorously (avoid forcing bad trades). Always define risk first (SL placement and impact), then apply a personal minimum risk-to-reward (R/R) ratio. Formula for minimum win rate: `$$\frac{1}{(1+R)} \times 100 = \% \{ of Win Rate}$$` Example: 1:3 R/R needs only 25% win rate to break even. A simple R/R-to-win-rate table is provided (e.g., 1:2 = 33%, 1:3 = 25%). Entry occurs only when personal risk guidelines are met (position size, % of account risked). Exit can be full close or scaled (e.g., dollar-cost averaging). Post-trade evaluation focuses on process adherence, not P&L keep the system simple and consistent. 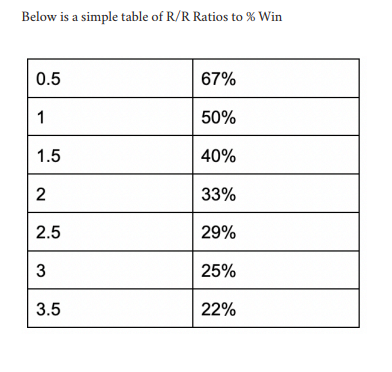 ## Chapter 2: Basics of Day Trading Day trading leverages capital for quick profits but carries high risk from rapid swings. Core concepts covered: - [ ] Market trends & ranges (Ch. 2.1) - [ ] Market structure (MSB) (Ch. 2.2) - [ ] Supply & demand (Ch. 2.3) - [ ] Support & resistance (Ch. 2.4) - [ ] Moving averages (Ch. 2.5) - [ ] RSI (Ch. 2.6) - [ ] MACD (Ch. 2.7) - [ ] Using Fibonacci in day trading (Ch. 2.8 – the core of the book) - [ ] ### Key Technical Foundations - [ ] Trends: Bullish (higher highs/higher lows), bearish (lower highs/lower lows), sideways (accumulation/distribution). HTF trends are more reliable. Markets cycle: Accumulation → Distribution → Manipulation (sometimes) → Expansion (trend). - [ ] Wyckoff principles: Trading ranges show equilibrium; accumulation/distribution by institutions precedes breakouts. Laws of supply/demand, cause/effect, effort vs. result. - [ ] Market Structure (MSB): Series of peaks/valleys (fractal across timeframes). Bullish = HH/HL (break prior high confirms); bearish = LH/LL. Breaks confirmed by trend-line violation, rejections, or series of HH/HL or LH/LL + volume/momentum. - [ ] Supply & Demand Zones: Created by large funds splitting massive orders to avoid slippage. Demand zones (support) = areas of heavy buying (draw rectangle from swing low to last small candle before surge). Supply zones (resistance) = heavy selling (similar method). Price oscillates between them; trade reversals here for excellent R/R. SC Ultra TradingView tool automates detection. - [ ] Support & Resistance: Horizontal swing-point levels. Support absorbs selling; resistance absorbs buying. Draw major daily levels (not obsessed with every minor one). Use for entries/exits; combine with other tools. Levels can flip roles in trends. - [ ] Moving Averages: Lagging trend filters. Common setups: 13/21 SMA (short-term daily), 200 EMA (long-term); golden cross (50 SMA > 200 EMA), death cross (opposite). 8 EMA (4H) ≈ 34 SMA (1H). Double-crossover method (e.g., 8/21 or 13/34) reduces whipsaws. Fibonacci numbers (13, 21, 34, 55) work exceptionally well as MAs on daily/weekly charts. SMA (equal weight) vs. EMA (recent data weighted more). - [ ] RSI (Relative Strength Index): 0–100 scale; >70 overbought, <30 oversold. Formula `$RSI = 100 - \frac{100}{1 + RS}, \quad RS_t = \frac{\{Average Gain}_t}{\text{Average Loss}_t}$` - [ ] Use for oversold bounces or divergences (price makes new high/low but RSI does not → reversal warning). Lagging indicator. - [ ] MACD: Used for trend confirmation via crossovers (mentioned in later examples with Fib). 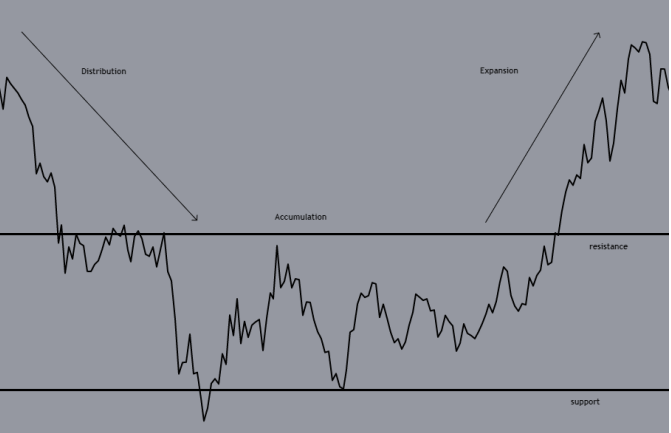 ## Chapter 2.8: Using Fibonacci in Day Trading (Core Theory) Fibonacci numbers/ratios (named after Leonardo Fibonacci) appear throughout nature and markets, following the same mathematical rules. Key ratio: golden ratio ≈ 1.618 (and reciprocals like 0.618). Tools: - [ ] Retracement levels (most common): 0.236, 0.382, 0.5, 0.618, 0.786 – act as dynamic support/resistance. - [ ] Extensions (1.272, 1.618, etc.) for profit targets. - [ ] Arcs and time targets #### Specific Fibonacci Cycles Setups (high-probability with confluence): - [ ] 0.618–0.236 Retracement (after market structure break in trend): - [ ] Draw Fib from swing low to high (or vice versa). - [ ] Enter on rejection at 0.618 (or sweep of 0.236 low). - [ ] TP follows sequence (often to next Fib level or 1.618 extension). - [ ] Rules: Use on trending assets post-MSB; combine with supply/demand. #### 0.618–0.236 Extension (post-rally MSB): Targets old highs or 1.618 levels. - [ ] Fibonacci Time Targets: Project future turning points on Fib-numbered days (13, 21, 34, 55, 89, etc.) from major tops/bottoms. Least emphasized but useful on daily charts. - [ ] Golden Spiral / Cycles: Markets operate in cyclical, predictable patterns mirroring natural phenomena. Integrate with S/D zones, MACD/RSI crossovers, and MAs for confluence. - [ ] Trading Rules for Fibonacci: #### Master basics first. - [ ] Use multiple timeframes. - [ ] Clear entry/exit, stop-loss always. - [ ] No revenge trading. - [ ] Seek actual high-probability setups only. - [ ] Examples show combining Fib with demand zones + MACD for trend reversals and precise TPs. 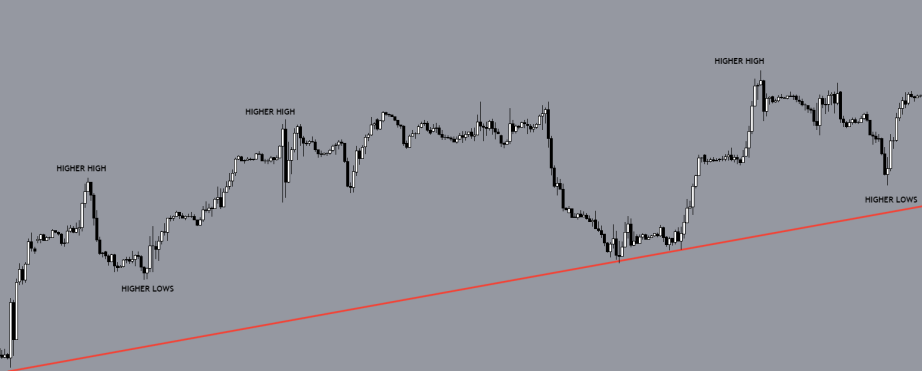 ## Chapter 3: Putting It All Together + Trading Styles Combines all tools into practical strategies: - [ ] 3.1 Scalping (NOT for beginners – fast, high-frequency). - [ ] 3.2 Swing Trading (beginner-friendly – holds hours to days). - [ ] 3.3 Position Trading (beginner-recommended – longer holds, lower stress). > Emphasizes confluence (structure + S/D + Fib + indicators) and higher-timeframe bias. ## Later Chapters (4–9) - [ ] Order Types: Market, limit, stop-loss, etc. - [ ] Risk Management (Ch. 5): Position sizing, R/R, capital preservation – non-negotiable. - [ ] Leverage (Ch. 6): Powerful but dangerous in crypto; use cautiously. - [ ] Psychology in Day Trading (Ch. 7): Discipline, emotional control, patience. - [ ] Trading Rules (Ch. 8): Detailed checklist – map S/R & valid S/D zones, Fib liquidity pools, confirm bias with MACD/RSI/MAs, watch session times (NY open/Asia close), premium/discount areas, fractal nature of markets. - [ ] Conclusion (Ch. 9): Reinforces that Fibonacci Cycles Theory, when combined with fundamentals (supply/demand, structure, indicators) and strict risk/psychology rules, provides a repeatable edge in crypto day trading. > READ THE FULL BOOK FOR FREE IN THE LINK BELOW
Read Summary →
How To Master Liquidity
# Welcome to this comprehensive liquidity guide. *Written by SoulzBTC* Inside, you will learn how to understand markets from an institutional perspective. This isn't about indicators or traditional retail strategies. This is about understanding how and why price actually moves, where liquidity sits, and how large participants manipulate markets to fill their orders.  What makes this different? Most trading education teaches you to follow trends, draw lines, and use lagging indicators. Don’t get me wrong, those things work. But, that approach keeps you reacting to what already happened. These concepts teach you to anticipate what's likely to happen next by understanding the mechanics behind price movement. You'll learn to identify: - [ ] ● Where institutional orders are sitting - [ ] ● Where retail traders are trapped - [ ] ● Which direction price needs to move to access liquidity - [ ] ● When manipulations are occurring versus genuine moves  How to use this guide: This guide builds progressively. Each section builds on the previous one. Don't skip ahead. The foundation concepts are critical to understanding the advanced material. Read through once to understand the concepts. Then study with charts open, practicing identification. Finally, backtest these concepts on historical price action before trading them live.  SoulzBTC
Read Summary →Journal
Blogs
Why Algorithmic Trading is the Future of Crypto
## The Shift from Manual to Algorithmic The crypto market operates 24/7 across hundreds of exchanges. No human trader can monitor every opportunity, react in milliseconds, or maintain emotional discipline through extreme volatility. This is where algorithmic trading fundamentally changes the game. ## Speed Advantage Traditional manual trading relies on human reaction times of 200-300 milliseconds. Algorithmic systems execute in under 1 millisecond. In a market where prices can move 2-3% in seconds during high volatility events, this speed differential translates directly into profit. ## Emotional Discipline The biggest enemy of any trader is emotion. Fear causes premature exits. Greed holds positions too long. Algorithms follow rules without exception, executing the strategy exactly as designed regardless of market sentiment. ## Data-Driven Decision Making Modern quant strategies process thousands of data points simultaneously — order book depth, funding rates, on-chain metrics, social sentiment, and cross-exchange correlations. No human can synthesize this volume of information in real time. ## Getting Started At TAQUANT, we provide institutional-grade algorithmic trading infrastructure accessible to all traders. Our platform handles the complexity of exchange connectivity, order routing, and risk management so you can focus on strategy development. The future of crypto trading is algorithmic. The question is not if, but when you make the switch.
Read Article →Insights
Market Insights
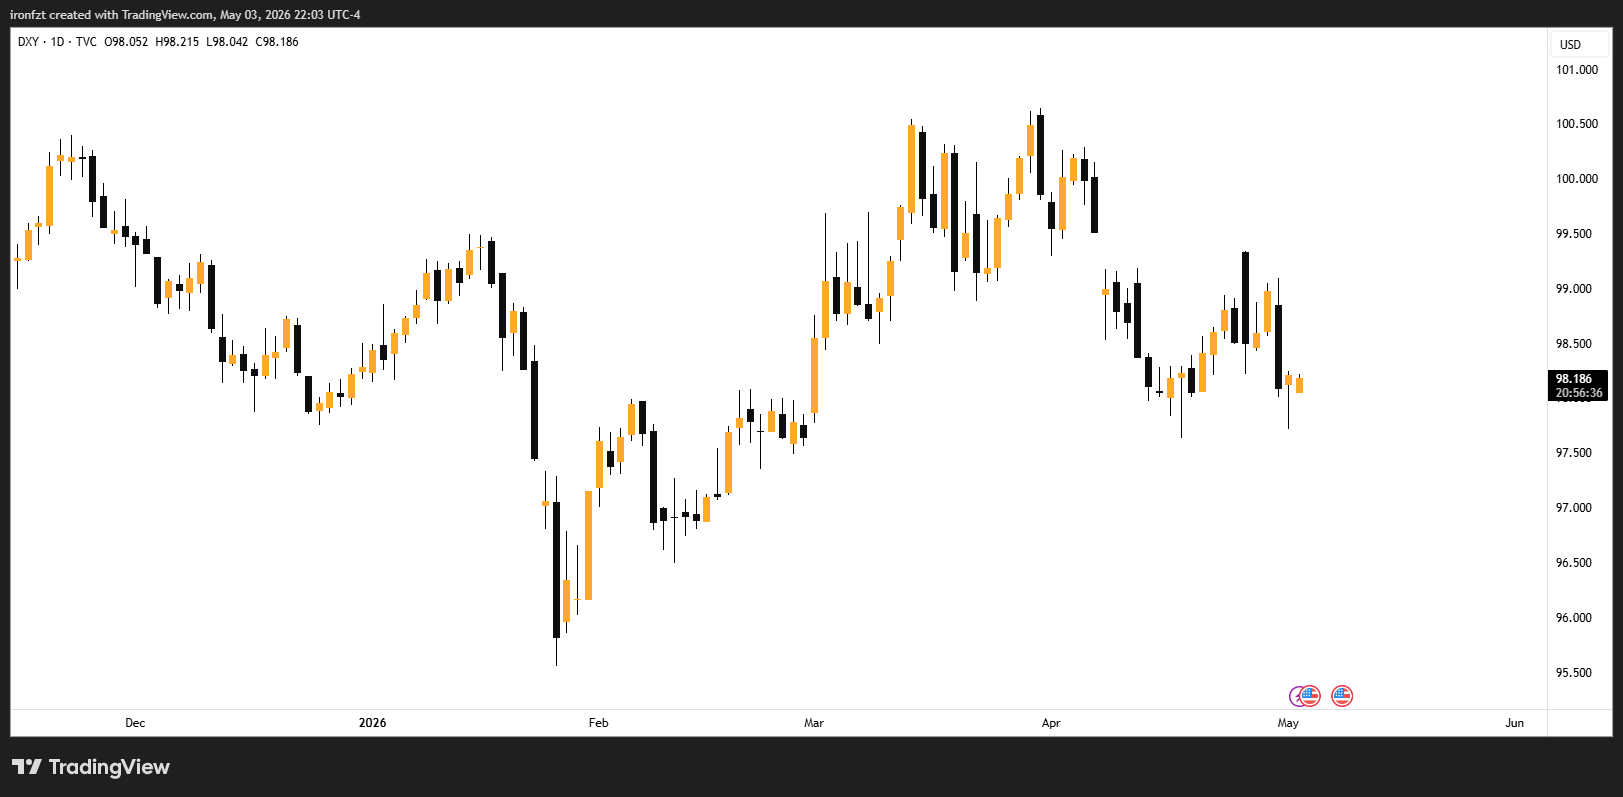
Weekly Market Insights | May 4, 2026
# **TA QUANT WEEKLY MARKET INSIGHTS** ### MARKET SNAPSHOT | Asset| Price| Weekly Change| Sentiment| |--------|--------|--------|--------| | BTC| ~$78,400| +3.4% (wk)| Fear (recovering)| | ETH| ~$2,310| +0.9% (wk)| Fear| | SOL| ~$84| Flat| Neutral| | Gold (XAU)| ~$4,620| -3.2% (wk)| Under Pressure| | Brent Crude| ~$108-111/bbl| +7.5% (wk)| War Premium Elevated| | DXY| ~98-99| Two-month low| Weakening| ### MACRO + GEOPOLITICAL: PROJECT FREEDOM AND A STALLED DEAL ##### The War Enters Month Three: Where Things Stand The US-Iran war crossed the two-month ceasefire mark this weekend with no formal peace agreement in place and both sides signaling they are prepared to hold their positions indefinitely. The ceasefire, technically extended by Trump on April 21, remains in a gray zone. The US is actively maintaining a naval blockade of Iranian ports, while Iran continues to restrict commercial transit through the Strait of Hormuz. Both actions have been labeled violations by the opposing side. The most dramatic development going into the week is 'Project Freedom,' announced by President Trump on Sunday May 3. Starting Monday, the US will begin escorting foreign vessels stranded in the Strait of Hormuz using a force that includes guided-missile destroyers, more than 100 aircraft, and approximately 15,000 service members. US Central Command was careful to clarify this is not a traditional escort mission, but Iran's response was immediate. Senior parliamentary official Ebrahim Azizi warned that any American interference in the strait constitutes a ceasefire violation and that the waterway 'will not be managed by Trump's delusional posts.' A vessel was also struck by unknown projectiles in the strait over the weekend, with all crew reported safe. Project Freedom context: Around 20,000 seafarers remain stranded in and around the Strait of Hormuz after more than two months of blockade. One tanker captain told CNN: 'Ceasefire is not for seafarers. Ceasefire is for normal people.' The humanitarian dimension of the Hormuz crisis is now becoming a diplomatic pressure point. On the diplomatic side, the week ended with a whimper. Trump canceled plans to send envoy Steve Witkoff and Jared Kushner to Islamabad on Saturday, writing on Truth Social that there was 'tremendous infighting and confusion within their leadership' and that Iran should 'just call' if they want to talk. Iranian Foreign Minister Araghchi had traveled to Islamabad over the weekend but met only with Pakistani officials before departing, signaling that direct talks remain deadlocked. Iran did submit a fresh proposal. Pakistan confirmed Tehran sent an updated plan calling for ending the war on all fronts including Lebanon, with a push to resolve issues within 30 days rather than accept a two-month ceasefire extension proposed by Washington. Iran also separately floated reopening the Strait of Hormuz while deferring nuclear talks. Trump reviewed the proposal over the weekend and said he 'can't imagine that it would be acceptable.' A senior Iranian military official said renewed conflict is 'possible,' while Iranian media has reported that Tehran is preparing military relocations and 'new surprises' should the war resume. ##### The 60-Day War Powers Clock A significant legal and political dimension has entered the picture this week. Under the 1973 War Powers Resolution, the president must notify Congress within 48 hours of committing US armed forces to hostilities, and those forces must be withdrawn within 60 days unless Congress authorizes the deployment. The 60-day clock is either approaching or has already passed depending on when you count from February 28. Trump wrote to congressional leaders on Friday asserting that 'hostilities' with Iran have 'terminated' because there has been no exchange of direct fire since April 7. This framing is aimed at resetting or pausing the clock. Several Republicans have nonetheless signaled they want either a wind-down of operations at the 60-day mark or formal Congressional authorization. The legal ambiguity around whether a ceasefire with an active blockade constitutes 'terminated hostilities' is likely to generate significant political noise this week. ##### Fed Holds, PCE Spikes, and Warsh Waits The Federal Reserve met in late April and held rates unchanged at 3.50-3.75%, but the decision came with four dissents, marking the most internal disagreement at the Fed since the early 2022 rate hike cycle. The division reflects a genuine split between officials who think energy-driven inflation is transitory and those who are increasingly worried about second-round effects. PCE data released for March confirmed the inflation picture is deteriorating. The headline PCE price index rose 0.7% month-on-month, accelerating the annual rate from 2.8% to 3.5%. Core PCE also climbed to 3.2% annually. This is materially above the Fed's 2% target and reinforces the case for a hold. Markets are now beginning to price in the possibility of a rate hike in 2027, a scenario that was near-zero probability six weeks ago. Kevin Warsh's confirmation to replace Powell, whose term expires May 15, is pending Senate committee vote. Markets assume confirmation given Republican Senate control. Warsh will inherit a policy environment where the inflation trend is moving in the wrong direction and the primary driver is a geopolitical conflict with no clear resolution timeline. ### CRYPTO: BTC + ETH ##### Bitcoin: Through $78k, Targeting $80k BTC closed April as its best ETF inflow month of 2026, pulling in roughly $2.44 billion in spot ETF net inflows, the strongest since October 2025. Price has responded accordingly, with BTC pushing through $78,000 to open May. CoinDesk flagged $78,557 as the price going into the week, up nearly 3% over seven days from last week's $76k close. The technicals are increasingly constructive. BTC is trading above its 100-day EMA at $75,623, which has flipped to support. The RSI approaching 60 is elevated but not overbought. The ascending triangle that analysts identified last week remains intact, and a clean break above $80,000 is being widely watched as the trigger for a potential run toward $88,000-$93,300 (the 50% Fibonacci retracement of the macro move down). One structural signal stands out. Bitcoin whale wallets holding more than 1,000 BTC have grown by 142 addresses over the past six months. Exchange reserves are at a 7-year low. Strategy (formerly MicroStrategy) continues to accumulate, now holding approximately 780,897 BTC representing nearly 3.8% of all circulating supply. These supply-side dynamics are compressing the available float at a time when ETF demand is firmly positive. The one cautionary note is the futures funding rate anomaly. BTC's 30-day average funding rate has drifted to approximately -5%, against a historical norm of +8%. The standard interpretation is that institutional investors long on spot BTC via ETFs are simultaneously shorting futures as a carry or hedge trade. Historically, extreme negative funding periods resolve through short squeezes. BTC long/short ratio currently sits at 47.5% longs vs 52.5% shorts, a rare slight short majority that creates asymmetric upside if a squeeze develops into the $80,000 level. ##### Ethereum ETH is trading around $2,310, essentially flat on the week after last week's institutional inflow momentum cooled. The $2,400 level has now been established as a clear multi-month ceiling, with multiple rejection wicks visible on the daily chart. A clean close above $2,400 would shift the technical focus toward $2,800. On the regulatory front, a meaningful development came through the US Senate. The Clarity Act, which governs crypto market structure, cleared a key stablecoin yield hurdle. The final text blocks crypto firms from offering stablecoin yield products that structurally resemble bank deposits, but permits 'bona fide' staking and reward transactions. This removes a key legislative roadblock and represents meaningful progress toward a regulatory framework that institutional capital has been waiting on before increasing allocations to ETH-native DeFi. The Tether Q1 report also provided a positive macro signal for the stablecoin infrastructure underpinning crypto markets. Tether posted $1.04 billion in Q1 profit and reported $8.23 billion in reserve buffers, reinforcing the health of the stablecoin layer that supports trading volumes across the ecosystem. ##### Altcoins and Broader Market BTC dominance climbed to 60% as April closed, its highest reading in months. Stablecoin volume at $167 billion represents 137% of total 24-hour crypto market volume, confirming capital is queuing in stable assets rather than rotating into altcoins. This is not a classic altseason setup. Capital is defensive and majors-anchored. The Consensus 2026 conference is opening in Miami this week, which historically injects a short-term narrative and price catalyst into specific sectors. Worth watching: the FOMC hold and the PCE data have actually slightly increased rate cut probability from near-zero to approximately 15% for late 2026, which is a marginal positive for risk assets. RWA tokenization has hit $19.32 billion in total value, up 256% in 15 months, and Hyperliquid controls roughly 70% of on-chain perps. These structural growth trends are attracting institutional attention even in the current macro fog. ### GOLD (XAU/USD) Gold is under significant pressure this week, trading around $4,620 after a rough end to April. The metal is now down approximately 15% from its pre-war peak, a counterintuitive move for a traditional safe-haven but one that reflects the specific mechanics of this crisis. Brent crude above $110 is pushing inflation expectations higher, which reduces rate cut probability, which in turn reduces the attractiveness of non-yielding gold. The World Gold Council's Q1 2026 report, released last week, showed record global gold demand in the period. Total demand rose 2% year-on-year to 1,230.9 tonnes, with bar and coin demand up 42% to 474 tonnes, the second-highest quarterly figure on record. Asian investors were the primary buyers. The divergence between record physical demand and declining price reflects the overriding pressure from inflation expectations and the opportunity cost of holding a non-yielding asset in a rising-rate environment. The DXY weakening to a two-month low around 98-99 is one of the few near-term positives for gold. Dollar weakness typically provides a tailwind for gold, which is priced in USD. The yen rally following suspected Bank of Japan intervention also contributed to dollar softness late last week. If DXY continues to slide toward the 95-96 zone, gold could see meaningful support, particularly if Iran talks show any sign of progress that would cap oil prices and ease the inflation narrative. ### OUTLOOK: THE WEEK AHEAD ##### Project Freedom and the Hormuz Test The single biggest market driver this week is the execution and reaction to Project Freedom. The US has committed significant naval assets to escort stranded vessels out of the Strait of Hormuz beginning Monday. If the operation proceeds without direct Iranian military response, oil prices could ease and risk assets including BTC would benefit. If Iran executes on its warning and treats the escorts as a ceasefire violation, the risk of renewed strikes is very real, and oil would spike above $115-$120. Markets are watching Trump's framing carefully. He has told Congress that hostilities have 'terminated,' which would allow him to sidestep the War Powers deadline. But Project Freedom is an active military operation in a contested waterway against the explicit wishes of a country the US is technically in a ceasefire with. The legal and geopolitical interpretation of that is highly contested. Any resumption of direct fire would immediately collapse the ceasefire framework. Key Events Calendar: May 4-8 - **May 4:** Project Freedom begins - US naval escort operation launches in Strait of Hormuz. Watch for Iranian response and any tanker incidents. - **May 5:** Services PMI for April + JOLTS job openings data for March - Key read on service-sector inflation persistence - **May 6:** ADP Nonfarm Employment Change for April - private payrolls preview - **May 7:** Initial Jobless Claims - continuing signal on labor market health under energy inflation - **May 7-8:** Consensus 2026 conference in Miami - industry catalysts, policy panels, potential narrative movers for specific sectors - **May 8:** Nonfarm Payrolls (April) + Unemployment Rate + UMich inflation expectations. The most important macro print of the week. - **May 15:** Jerome Powell's term as Fed Chair expires. Warsh confirmation vote expected beforehand. ### TA Quant Positioning View The dominant setup is a genuine binary. Project Freedom resolving without incident would be the first concrete positive development in this conflict since the original ceasefire, and it would immediately shift oil, rate, and crypto narratives. BTC is technically positioned to take out $80,000 on any meaningful geopolitical relief. The ETF bid is real, the supply float is compressed, and the funding rate anomaly creates a coiled short-squeeze setup. The downside risk is symmetrically severe. Iran has stated clearly that it considers the escort operation a ceasefire violation. A single incident in the strait could restart the war. In that scenario, oil at $120+ would reprice every inflation-sensitive asset and put BTC back below $75,000 quickly. For market-making and algo strategies, this is a vol-expansion environment. Spreads are wide, catalysts are headline-driven, and the reward for getting the direction right before the market moves is substantial. Manage size, stay reactive, watch CENTCOM for any tanker incident reports.
Read Insight →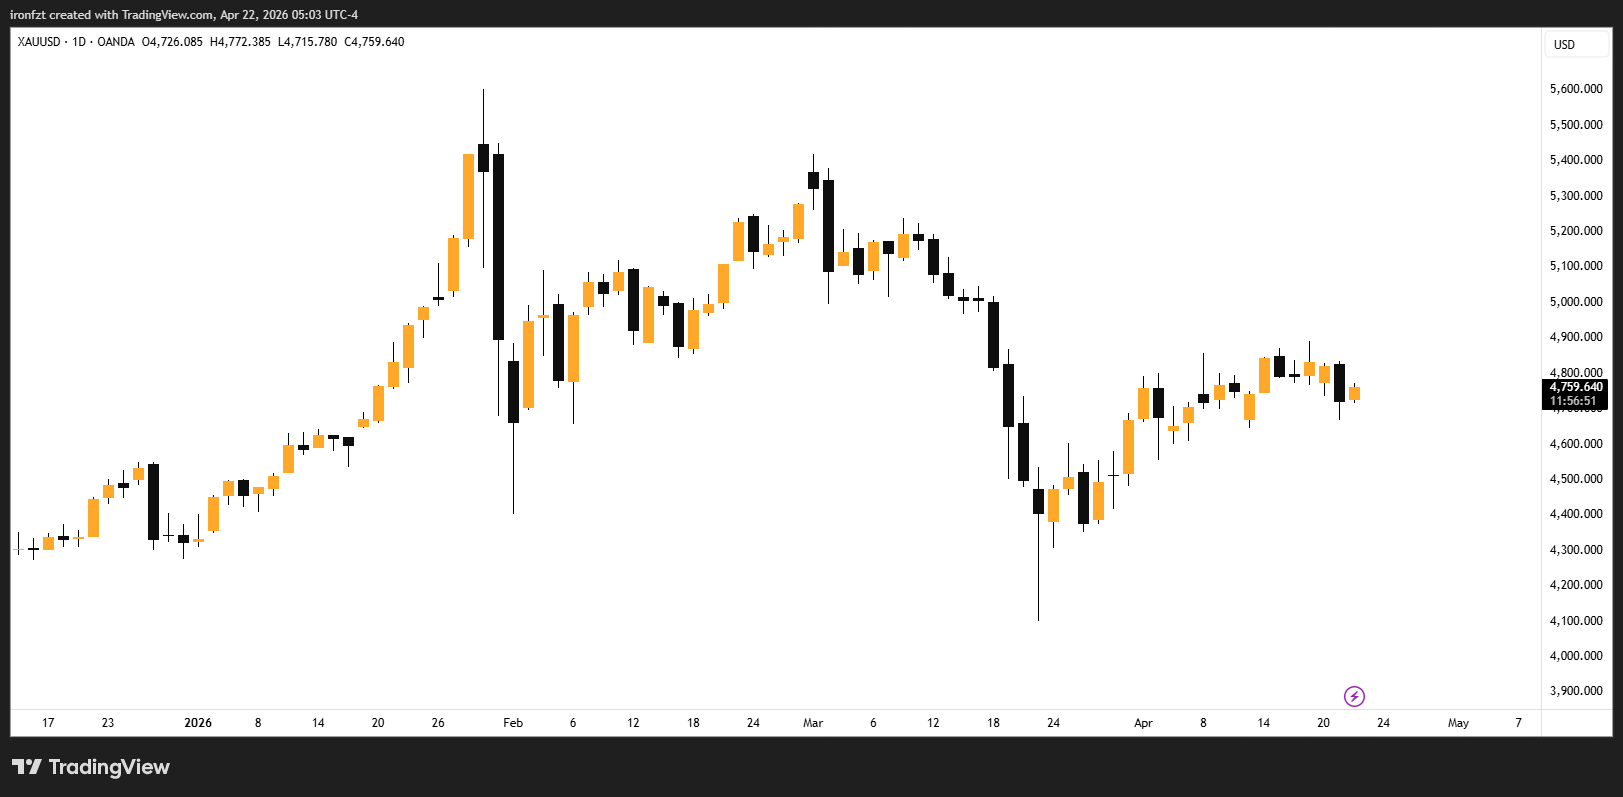
Weekly Market Insights | April 20, 2026
# TA QUANT WEEKLY MARKET INSIGHTS ### MARKET SNAPSHOT | Asset | Price| Weekly Change | Sentiment | |--------|--------|--------|--------| | BTC | ~$75,800 | +4.1% (wk) | Fear (improving) | | ETH| ~$2,310 | +3.2% (wk) | Fear | | SOL| ~$85.50 | Flat | Neutral | | Gold (XAU) | ~$4,700 | -1.6% (wk) | Cautious | | Brent Crude | ~$94-96/bbl | Volatile | Geopolitical | | DXY | ~98.5 | Retreating | Mixed | --- ### MACRO + GEOPOLITICAL: CEASEFIRE ON THE EDGE ##### The War This Week: Ceasefire Extended, Talks Uncertain The defining macro event of the week is the fragile extension of the US-Iran ceasefire, announced by President Trump on April 21. The two-week truce, which was set to expire Wednesday, has been extended indefinitely, but only until Iran submits a unified negotiating proposal. The naval blockade of Iranian ports remains in full force. The week opened with serious escalation. Over the weekend, the US Navy seized an Iranian-flagged cargo vessel near the Strait of Hormuz after it ignored warnings. Tehran retaliated by targeting ships in the strait and reasserting control over the waterway, directly accusing the US of ceasefire violations. Iran's Foreign Minister Abbas Araghchi called the US blockade of Iranian ports an 'act of war.' Oil surged more than 5% at Monday's open in response. By Tuesday, reports emerged that Iran may be willing to send a delegation to a second round of talks in Islamabad, reversing earlier signals it would not attend. This partial thaw pulled Brent crude back below $95. Trump said he was 'optimistic' about a deal but simultaneously warned he was ready to resume bombing if talks collapse, and insisted the Strait of Hormuz would remain blocked until a comprehensive agreement is signed. > Trump on April 21: 'We're going to end up with a great deal.' On the same day, he said he was ready to resume bombing if talks don't go well. Both statements are true and equally priced in by markets. The core sticking points remain unchanged: Iran demands control of the Strait of Hormuz, war reparations, continuation of its nuclear program, and a broader regional ceasefire including Lebanon. The US demands no nuclear enrichment, full reopening of the Strait, and has made clear it will not lift the naval blockade until a deal is finalized. There is no overlap between those positions yet. The human cost of the conflict continues to grow. Iran's forensics chief reported nearly 3,400 deaths inside Iran since strikes began on February 28. More than 2,200 have been killed in Lebanon and 32 in Gulf states. The death toll is increasingly becoming a factor in domestic Iranian politics and in the international pressure on both sides to reach a resolution. ##### The Fed Chair Question: Warsh Moves to Center Stage The second major macro story of the week is Kevin Warsh's Senate Banking Committee confirmation hearing on April 21. Warsh, Trump's nominee to succeed Jerome Powell when his term expires May 15, represents a meaningful policy inflection point, particularly for crypto markets. Warsh's financial disclosures revealed over $100 million in crypto-related investments across more than 20 projects, including Bitwise Asset Management, Solana, dYdX, Polymarket, and Bitcoin Lightning infrastructure firm Flashnet. He would be the first Fed Chair nominee in history with meaningful direct exposure to digital assets. He would need to divest those positions under Fed ethics rules if confirmed. At the hearing, Warsh emphasized Federal Reserve independence, pushing back on Trump's repeated public calls for immediate rate cuts. 'The President never asked me to commit to any particular interest rate decision, and nor would I ever agree to do so,' he said before the committee. Trump, in a CNBC interview the same day, said he would be disappointed if Warsh doesn't cut rates immediately, creating a visible public tension. For markets, the nuance matters. Warsh has historically been viewed as an inflation hawk, opposing rate cuts and quantitative easing after the 2008 crisis. But he has also argued that the Fed has too often been slow to respond to changing conditions. With inflation running at 3.3% annual and oil prices elevated by the war, the policy path is genuinely unclear. Markets currently price in effectively zero chance of a rate cut before late 2026, with only a 30% probability of one cut by December. A Warsh-led Fed that treats energy-driven inflation as transitory could shift that pricing significantly. --- ### CRYPTO: BTC + ETH ##### Bitcoin: Breaking Out of the Range BTC has pushed above the $75,000 level that analysts flagged last week as the make-or-break threshold for bulls. The asset briefly touched $76,535 Tuesday morning before pulling back as Warsh's hearing unfolded and Iran talk uncertainty resurfaced. The weekly picture looks constructive, with BTC up roughly 4% from last week's close around $72,800. Crucially, this is the first sustained hold above $75,000 since the war-driven selloff in late February. The two-month range between $62k and $75k appears to be resolving to the upside, supported by a clear uptick in institutional flows. Spot BTC ETFs have added over $1.6 billion this month, with cumulative net inflows now at $57 billion. Strategy (formerly MicroStrategy) added 13,927 BTC to its holdings, bringing total holdings to approximately 780,897 BTC, or roughly 3.8% of all circulating supply. Technically, BTC has formed an ascending triangle pattern on shorter timeframes. The Supertrend indicator has flipped bullish, RSI is rising, and the $75,000 level is now acting as support. The next meaningful resistance cluster sits at $88,000-$93,000 (the 50% Fibonacci retracement of the macro move). A confirmed weekly close above $76,000 would be the cleanest technical confirmation of a regime shift. ``` BTC Key Levels Support: $75,000 / $72,000 | Resistance: $80,000 / $88,000 / $93,300 | Invalidation: Weekly close below $72,000 ``` ##### Ethereum ETH is trading around $2,310, up modestly on the week. The bigger story for ETH is the institutional flow narrative. Spot Ethereum ETFs recorded $328 million in weekly inflows, the best week since January, with BlackRock's ETHA and Fidelity's FETH leading. Year-to-date ETH ETF net inflows have now crossed $197 million. This is still relatively modest compared to BTC ETF flows, but the direction is clear. On-chain, the DeFi space had a rough week. KelpDAO suffered a significant exploit over the weekend that hit Aave's ecosystem and caused AAVE token to fall sharply. Aave's core lending markets briefly hit 100% utilization, raising concerns about protocol solvency. CertiK flagged the situation as serious, while Aave CEO Stani Kulechov offered limited public commentary. The event is a reminder that DeFi remains high-risk even as institutional adoption accelerates. ``` ETH Key Levels Support: $2,200 / $2,050 | Resistance: $2,500 / $2,800 | Watch: Reclaiming $2,500 is the next meaningful structural target ``` ##### Altcoin Flows The altcoin picture remains mixed but showing early signs of broadening. XLM and TON posted gains above 5% in the past 24 hours, and the CoinDesk Memecoin Index is up over 3% on the week. The DeFi Select Index added 2% despite the KelpDAO/Aave situation, suggesting selective rotation rather than a sector-wide move. Worth noting: XRP-related products saw $56 million in outflows last week, and SOL products lost $2.3 million, suggesting institutional capital is consolidating into BTC and ETH rather than spreading across the altcoin stack. BTC dominance remains above 57%. A sustained drop in dominance would be the cleaner signal that the altseason rotation is underway. --- ### GOLD (XAU/USD) Gold has given back some of last week's gains, trading around $4,700 after briefly touching $4,850 on Friday following news that the Israel-Lebanon ceasefire corridor would remain open. The metal dropped as much as 2% on Monday as oil spiked on renewed Hormuz tensions and the US ship seizure, reigniting inflation concerns that weigh on rate cut expectations, which in turn weigh on non-yielding assets like gold. Gold is now down roughly 8-10% since the war began on February 28, which feels counterintuitive for a traditional safe-haven. The dynamic reflects the unusual nature of this crisis: oil-driven inflation reduces the probability of rate cuts, and the dollar has absorbed the majority of safe-haven flows. That said, with the ceasefire extended and talk of a possible deal still alive, any meaningful de-escalation that brings oil prices lower could quickly reprice rate cut expectations and create a strong tailwind for gold. The World Gold Council's technical model shows the DXY being capped at key resistance around 100.26-101.14 (the 38.2% retracement level of the 2025-2026 fall). As long as DXY stays below that zone, gold has structural support. The medium-term range remains constructive, with JPMorgan and Goldman maintaining $4,000-$6,300 as the 2026 band. Physical demand from China and central bank accumulation continues to provide a structural floor. --- ### TA Quant Positioning View The macro backdrop is shifting incrementally toward risk-on, but conviction remains low until the Hormuz situation resolves. BTC breaking and holding above $75,000 is the single clearest signal in the market right now. ETF inflows confirm institutional demand. The Warsh nomination, if confirmed, is a medium-term positive for crypto given his digital asset familiarity, though his inflation hawkishness is the near-term governor. For market makers and algo strategies, the current environment rewards reactivity over positioning. Vol is elevated across oil and crypto, spread opportunities remain wide, and the headline-driven price action creates systematic opportunities for strategies designed to capture dislocations. The next clean directional signal will likely come from whichever way the Iran talks break.
Read Insight →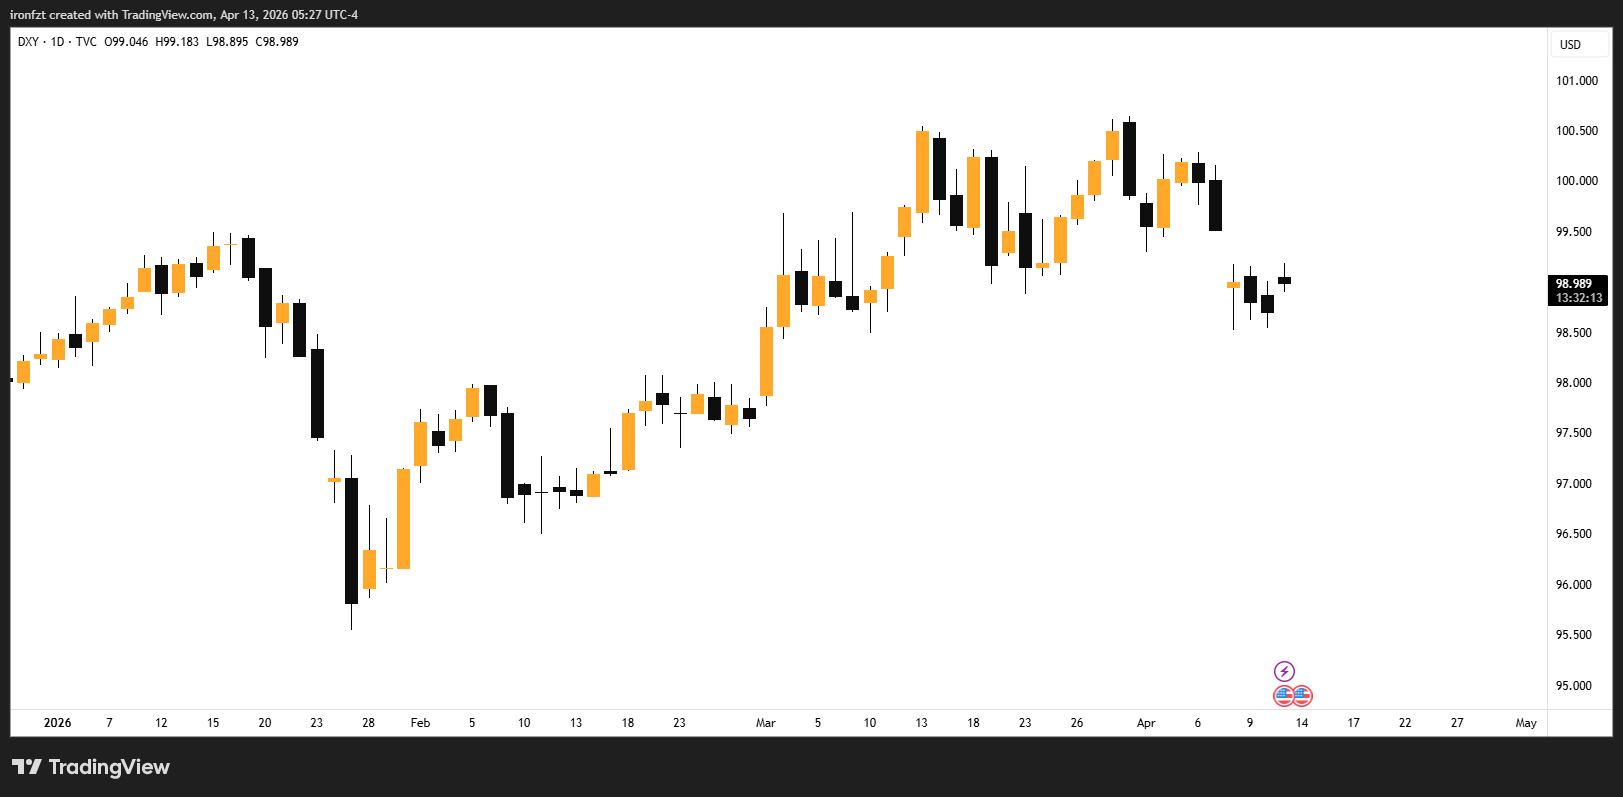
Weekly Market Insights | April 13, 2026
# TA QUANT WEEKLY MARKET INSIGHTS April 13-19, 2026 ## MARKET SNAPSHOT | Asset | Price | Weekly Change | Sentiment | |--------|--------|--------|--------| | BTC | ~$72,800 | +5.6% | Extreme Fear| | ETH | ~$2,237| +5.2%| Extreme Fear| | Gold| ~$4,780| +2.0%| Cautious Bid| | Brent Crude| ~$101.80| +7.9%| Geopolitical Premium| | DXY | ~99.0| Reclaiming 99 | Safe-Haven Bid| ## MACRO + GEOPOLITICAL OVERVIEW ##### The Hormuz Crisis: Where Things Stand Right Now This week marks a significant escalation in the US-Iran conflict that has dominated global markets since late February. The war, which began when the US and Israel launched coordinated airstrikes on February 28 under Operation Epic Fury, entered a critical new phase over the weekend. Peace talks held in Islamabad, Pakistan broke down after 21 hours of negotiations on April 12. The US delegation, led by Vice President JD Vance, accused Tehran of refusing to halt its nuclear program. Iran, for its part, demanded ongoing control of the Strait of Hormuz, payment of war reparations, a broader regional ceasefire (including Lebanon), and the release of frozen overseas assets. Neither side blinked. Following the collapse of talks, President Trump announced a US naval blockade of the Strait of Hormuz, effective Monday April 13 at 10am ET. CENTCOM clarified the blockade targets vessels entering and exiting Iranian ports specifically, and will not impede ships transiting to non-Iranian ports. Iran's IRGC immediately issued warnings that military vessels approaching the strait would be treated as ceasefire violations. The practical impact is severe. The Strait of Hormuz has been largely closed since February 28, disrupting roughly one-fifth of the world's seaborne oil trade. Saudi Arabia reported attacks on its oil facilities have reduced production capacity by around 600,000 bpd. The Asian Development Bank warned the prolonged conflict is the single biggest risk to the Asia-Pacific growth outlook, projecting regional inflation rising to 3.6% in 2026. #### Inflation Shock Arrives in US Data The first US CPI report since the war began confirmed what markets already feared. Consumer prices rose 0.9% in March, the steepest monthly jump since June 2022, pushing the annual rate to 3.3%, up sharply from 2.4% in February. Core CPI was more modest at 2.6%, suggesting the full oil shock has yet to fully transmit through the broader economy, but the direction is clear. The Federal Reserve is effectively boxed in. Markets now see essentially zero chance of a rate cut before late 2026, with just a 30% probability of one cut by December. Fed officials are watching energy prices as the primary variable. The longer Hormuz remains closed, the harder the inflation problem gets and the tighter the Fed's hands become. This is the core macro pressure bearing down on risk assets right now. ##### Dollar and Global FX The DXY recovered back above 99 on Monday after dipping below that level during last week's brief ceasefire-driven relief rally. The dollar has functioned as the primary safe-haven of this crisis, more so than traditional alternatives like the franc or yen, as energy inflation risk is perceived as harder on Europe and Asia than the US. The 52-week range for DXY sits between roughly 95.36 and 101.82, with the current level reflecting ongoing tension between crisis safe-haven demand and longer-term concerns about US fiscal trajectory. ## CRYPTO: BTC + ETH ##### Bitcoin BTC has spent the past two months range-bound between $62,000 and $75,000, with the current price sitting around $72,800. Sentiment remains deep in Extreme Fear territory despite recent price gains, a reflection of how macro forces are overwhelming any organic crypto momentum. The pattern is notable. A similar two-month consolidation played out between November 2025 and January 2026 before a breakdown, and analysts are flagging the structural similarity. Key levels to watch are $75,000 on the upside and $65,000 as the structural floor. A break of $65k would be significant and likely coincide with broader macro deterioration. On the positive side, TD Cowen published a note maintaining a $140,000 BTC price target by late 2026, citing its digital gold narrative and BTC's evolving role as a strategic reserve asset. Institutional integration via spot ETFs continues, and Bitget Research noted that short-term capital rotation is increasingly shaped by macro signals rather than crypto-native catalysts. Derivatives data shows open interest up about 4% weekly but funding rates marginally negative, suggesting controlled accumulation rather than aggressive leverage buildup. ##### Ethereum ETH is sitting around $2,237, recovering from its early-April lows near $2,058 but still well below the $3,000+ levels that would signal a genuine trend shift. BTC dominance is holding above 57%, which historically has capped altcoin outperformance. The thesis for ETH in 2026 remains tied to Layer-2 growth, DeFi stabilization, and whether institutional engagement accelerates. Fundstrat's Tom Lee has argued for a strong ETH cycle, with mid-to-high four-figure targets if adoption trends hold. On-chain activity remains the critical variable. For now, ETH is tracking macro conditions more than its own fundamentals. Notable protocol news: Aave passed a landmark governance vote directing 100% of application and product revenue back to AAVE token holders, resolving a months-long dispute over fee routing. Separately, Seamless Protocol began shutting down and Fantom Opera is set to close June 30 as it completes migration to Sonic infrastructure, reflecting continued ecosystem consolidation. ## GOLD (XAU/USD) Gold is trading around $4,780, recovering toward its mid-March highs after a sharp drawdown caused by the initial oil shock. Since the war began, gold has lost over 11% from pre-conflict levels as surging oil prices damped expectations for US rate cuts, creating an unusual macro environment where the traditional safe-haven trade underperformed the dollar. The dynamic is starting to reverse. The two-week ceasefire, even though it has now effectively collapsed, triggered a 2% weekly gain for gold as markets priced in earlier rate cuts. Gold has posted three consecutive weeks of gains, driven by a weaker dollar during the ceasefire window and growing concerns about inflation's durability. State Street's monthly gold monitor frames the current period as 'down but not out,' maintaining a base case range of $4,750-$5,500/oz into year-end. JPMorgan and Goldman Sachs have projected a range of $4,000-$6,300 for 2026. China remains a key structural buyer, with the PBOC at an all-time high of approximately 2,309 tonnes in official reserves. For gold to push materially higher, the market likely needs either a deal-driven rate cut repricing or a further escalation that forces flight-to-safety across all assets. A formal peace deal, if it ever materializes, could trigger a sharp gold selloff as oil prices fall and rate cut expectations get pushed back out. That is the key near-term risk to gold longs. ## ALTCOIN LANDSCAPE The altcoin market has shown interesting divergence this week. Rather than the unified beta movements of previous cycles, specific sectors are outperforming while others continue to bleed. This suggests a maturing market where capital is rotating based on perceived utility rather than hype. AI and compute tokens (FET, RENDER) have held up relatively well, as have privacy tokens (ZEC, DASH), with DASH posting a 22%+ gain on the week. The CoinDesk Computing Select Index has outperformed the broader CD20 benchmark. In contrast, many DeFi and Layer-1 tokens remain under heavy pressure, with assets like ENA, TIA, LDO, SUI, and ARB all down 50%+ over the past 90 days. ## OUTLOOK + WHAT TO WATCH The key variable for all markets in the week ahead is the Hormuz situation. The blockade has now officially begun, and the range of outcomes from here is wide. De-escalation toward a ceasefire or deal would likely trigger a sharp relief rally across crypto and equities, a gold selloff, and an oil price drop. Escalation, including potential military strikes, would do the opposite across the board. Vance left Islamabad saying diplomacy is not over, and that the US has a 'final and best offer' on the table. Iran's position remains focused on nuclear rights and Hormuz control as non-negotiables. The gap is significant, but both sides are clearly still talking. Markets will trade every headline. ## Calendar: Key Events This Week 1. April 14: US PPI data (March) - first major follow-up to the 3.3% CPI print 2. April 15: Federal Reserve Beige Book release 3. April 13 onward: Hormuz blockade enforcement begins, watch for any incidents 4. **Ongoing**: US-Iran diplomatic back-channel activity - any resumption of talks is the biggest potential catalyst
Read Insight →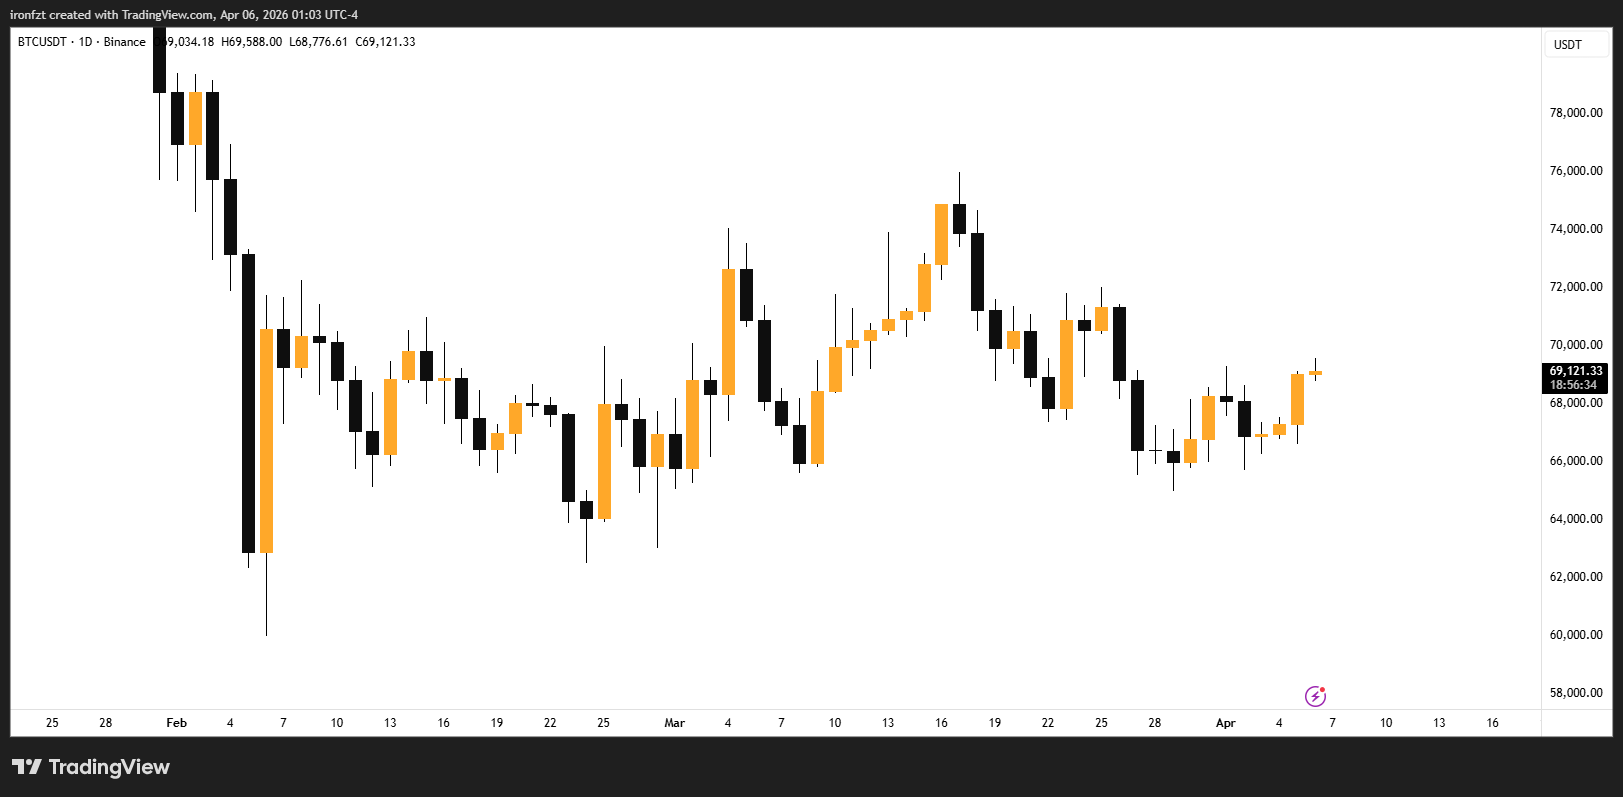
Weekly Market Insights | April 6, 2026
# **TA Quant Market Insights | *April 6-12, 2026*** ## Macro Overview The global macro backdrop remains unsettled heading into this week. Trade policy continues to cast a long shadow across all asset classes, with Trump's tariff architecture now a year old and its effects fully embedded in economic data. We are past the point where tariff risks are a future concern. They are showing up in every data point right now. February payrolls printed **negative **for the first time since COVID, and while March came in better than expected at 178,000 jobs with unemployment dipping to 4.3%, the broader trend remains fragile. The Fed is sitting in a tough spot. The funds rate holds at 3.50–3.75%, and CPI nowcasts have climbed to 3.71% from March's 3.25%, with PCE tracking at 3.58%, driven in part by energy shocks tied to ongoing Iran tensions. That inflation print has effectively killed any near-term rate cut expectations. Markets will be watching **FOMC minutes** on April 8 and ADP data on April 7 closely. The Middle East conflict remains a live risk on our radar. Any escalation from here carries real second-order effects across oil, inflation expectations, and risk sentiment broadly. ## Crypto: BTC and ETH  BTC is currently trading around $67,540, while ETH sits near $2,060. The Block The broader crypto market has been under sustained pressure, with total market capitalization sitting at approximately $2.38 trillion and the Fear and Greed Index registering at extreme fear levels. That said, we are watching some interesting signals beneath the surface. Exchange netflows showed 8,400 BTC withdrawn in a single day recently, the largest outflow in three weeks, and addresses holding 100 to 1,000 BTC increased positions by 2.3%, pointing to institutional-size accumulation. Historically, this kind of behavior near extreme fear readings tends to precede bottoming patterns rather than continued sell-offs. For ETH, the ETH/BTC ratio broke a 7-day downtrend recently, with the $2,050 to $2,100 range acting as a solid accumulation zone based on recent volume profiles. The next resistance cluster sits at $2,280 to $2,320. **Our view**: sentiment is washed out, but macro headwinds are real. We are watching the $67,500 BTC support level closely as a short-term trend indicator. A sustained hold above that opens the door to a test of $70,200. ## Forex 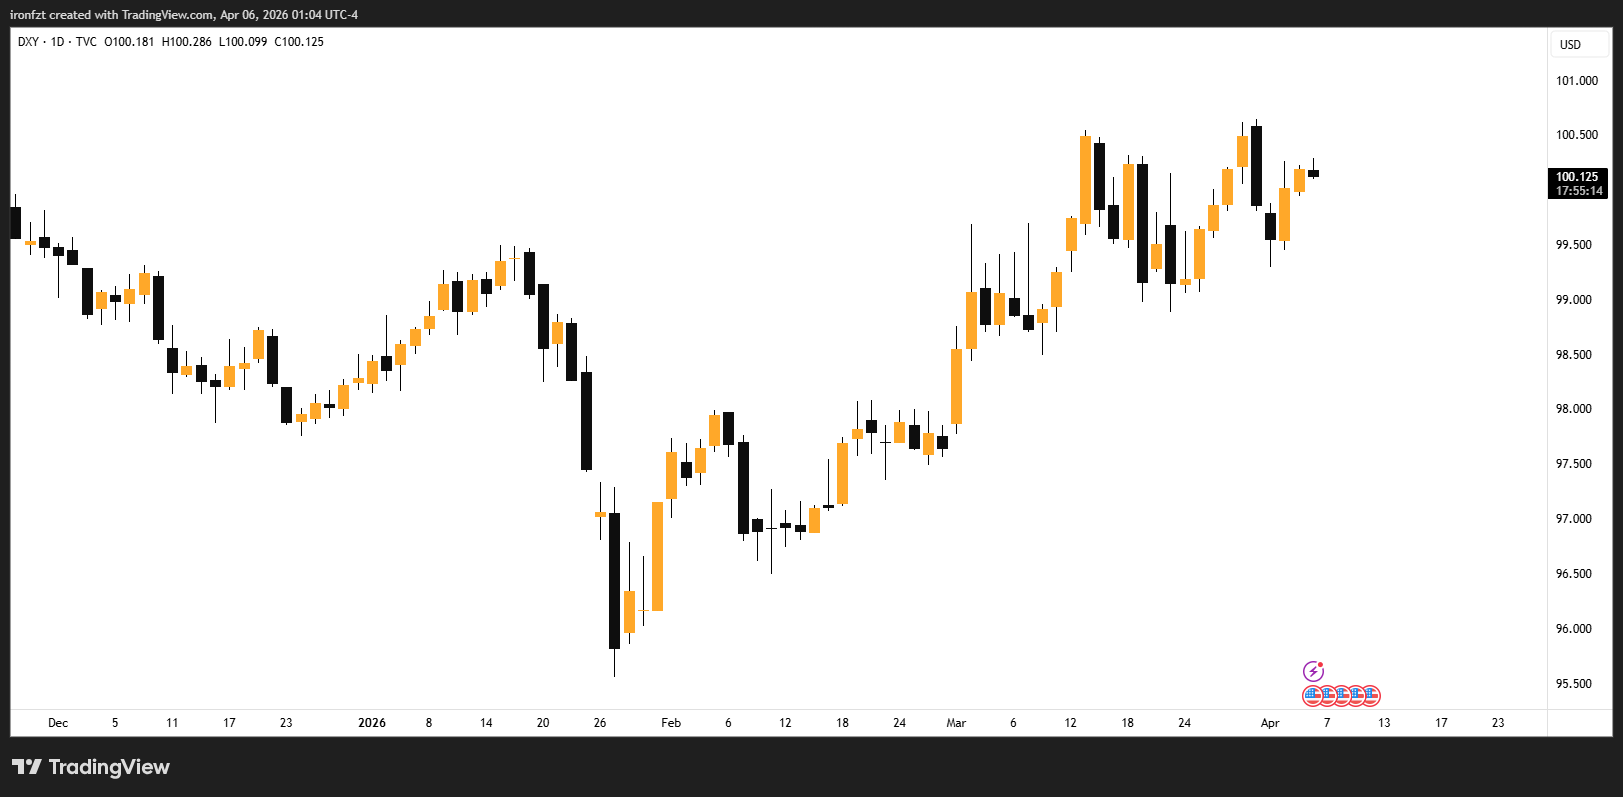 The US dollar has been under pressure for most of 2025 and into 2026, though recent inflation surprises have given it some footing. EUR/USD pulled back from 1.1818 to 1.1524 in March, with the ECB holding its deposit rate unchanged at 2.00% following 100bps of cuts last year. The rate differential between the Fed at 3.50–3.75% and the ECB at 2.00% remains a key driver of near-term dollar strength, but any dovish pivot from the Fed would shift that dynamic quickly. On USD/JPY, the pair has been trading above 159 with a near-term bullish bias. The BoJ's April 28 policy meeting is the next major catalyst, with markets uncertain whether the central bank will offer clear forward guidance on rate hikes. A senior BoJ official has stated the central bank will continue raising rates if economic projections remain on track. FXStreet A BoJ hike plus any softening in US data is the combination that would put real pressure on USD/JPY longs. We are keeping a close eye on DXY as it tests key long-term support levels. A break lower there would have broad implications across pairs and commodities. ## Gold 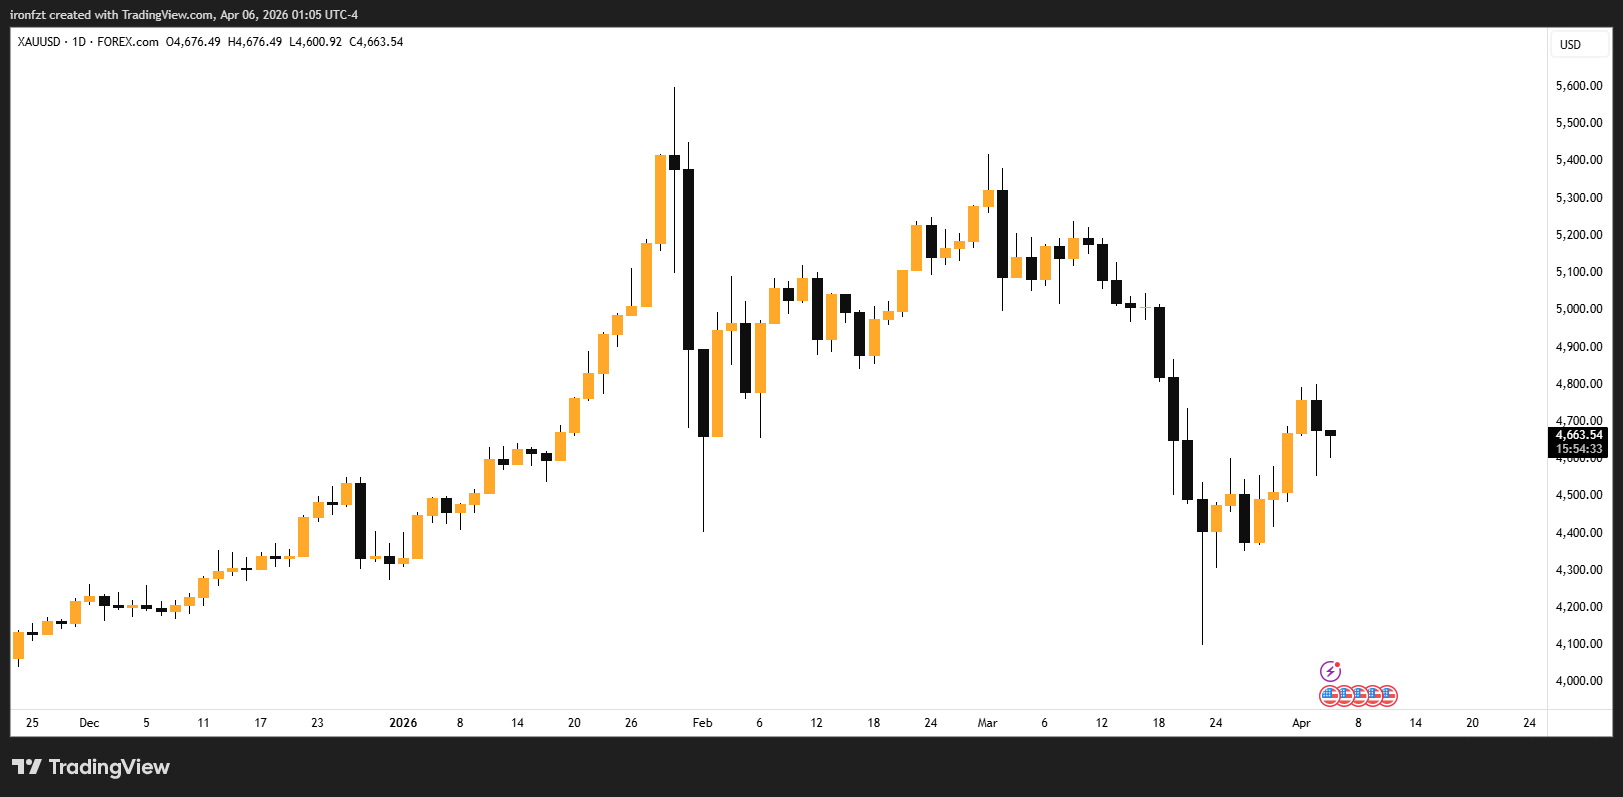 Gold remains one of the strongest macro stories of this cycle. Spot gold is trading around $4,676 as of April 5, with high volatility expected this week around FOMC minutes, US GDP data, and CPI release. The structural bull case is intact. Central bank buying, Fed rate cuts, a weaker dollar, concerns about Fed independence, and ETF inflows are all still in play as primary drivers. J.P. Morgan projects gold demand averaging around 585 tonnes per quarter in 2026, and maintains strong conviction that prices are tracking toward $5,000 per ounce by Q4 2026. Short-term, the metal is sensitive to Iran developments and any hawkish Fed repricing. U.S. ETF flows showed rotation out of commodities recently amid liquidity strains, though gold remains on track for a modest weekly gain of around 3% despite the recent pullback. We view dips as potential entries rather than trend reversals, given how well the macro setup holds up for gold over the medium term. ## Our Take Across all four areas, the theme is the same: elevated uncertainty with select opportunities for the patient and well-positioned. Crypto sentiment is deeply negative but accumulation signals are quietly building. Forex is driven by central bank divergence and geopolitical volatility. Gold retains its structural bid. And the macro picture hinges almost entirely on whether the Fed gets cover to ease or gets forced to hold. We will continue monitoring these setups closely and keeping our clients informed as conditions develop.
Read Insight →
Bitcoin Halving 2028: Early Positioning Strategies
## Macro Setup With the next Bitcoin halving projected for Q1 2028, institutional capital is already beginning to position. Historical data from the 2012, 2016, 2020, and 2024 halvings shows a consistent pattern: accumulation begins 18-24 months before the event. ## On-Chain Signals Current on-chain metrics suggest we are entering the early accumulation phase: - **Exchange reserves**: Down 12% YoY, indicating long-term holder accumulation - **MVRV ratio**: Currently at 1.8, below the historical overvaluation threshold of 3.5 - **Hash rate**: All-time high, signaling miner confidence in future price appreciation ## Recommended Positioning For algorithmic traders, we recommend the following framework: 1. **DCA Accumulation Bot**: Dollar-cost average into BTC with increased allocation on dips below the 200-day MA 2. **Volatility Harvesting**: Deploy options-based strategies to collect premium during low-volatility consolidation periods 3. **Cross-Exchange Arbitrage**: Capitalize on pricing inefficiencies that emerge during accumulation phases ## Risk Factors - Regulatory headwinds in major markets - Macroeconomic recession scenarios - Black swan events in DeFi protocols Position sizing should account for these tail risks with maximum 30% portfolio allocation to halving-thesis trades.
Read Insight →Stay Updated with Our Latest Research
Subscribe to receive notifications when we publish new research papers, strategies, and market insights.
Subscribe to Research Updates