![How To Master The Art of Trading [Liquidity, FVGs, Volume, etc.]](https://taquant-content.s3.eu-north-1.amazonaws.com/books/how-to-master-the-art-of-trading-liquidity-fvgs-volume-etc/1774847966889-Screenshot_30-3-2026_13520_.jpeg)
HOW TO MASTER THE ART OF TRADING
Written by SoulzBTC
The Trader's Foundation
I. WHAT IS CRYPTO TRADING?
Crypto trading is the act of buying and selling digital assets such as Bitcoin, Ethereum, and other altcoins to profit from price fluctuations. It takes place on online platforms that operate around the clock, unlike traditional stock markets. The goal is to capitalize on market volatility using a variety of strategies.
Traders can engage in:
- Spot trading (buying and selling assets directly)
- Futures and derivatives (speculating on price
- direction without owning the asset)
- Scalping, day trading, swing trading, or long-term investing
Success in crypto trading requires technical skills, proper risk management, and strong decision making.
II. UNDERSTANDING EXCHANGES & MARKET STRUCTURE
A crypto exchange is where traders buy and sell coins. These exchanges come in two types:
- Centralized exchanges (CEX) like Binance and Coinbase, which manage orders and hold your funds
- Decentralized exchanges (DEX) like Uniswap and dYdX, which allow peer-to-peer trading from wallets
Understanding market structure helps traders read charts and recognize patterns. Price typically moves in trends, ranges, and breaks through key levels like support, resistance, and liquidity zones. A few essential market structure concepts: Higher highs and higher lows indicate an uptrend Lower highs and lower lows suggest a downtrend Consolidation zones show indecision Breakouts reveal momentum shifts Reading market structure lets traders anticipate moves before they happen.
MASTERING PRICE ACTION TRADING
I. WHAT IS PRICE ACTION?
Price Action refers to the natural movement of price on a chart, without the use of lagging indicators. It focuses on reading candlesticks, chart patterns, and key levels like support, resistance, and trendlines to understand how the market behaves in real time.
Traders who use price action study how buyers and sellers interact, analyzing things like market structure, momentum, and liquidity zones to anticipate future moves. It helps identify potential entry and exit points by observing how price reacts at important areas, such as previous highs, lows, or zones of consolidation.
Price action trading relies heavily on clean charts, patience, and a deep understanding of market psychology. It is widely used because it adapts to all timeframes and works across different market conditions.
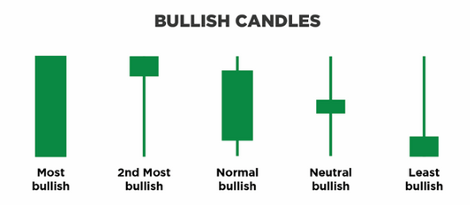
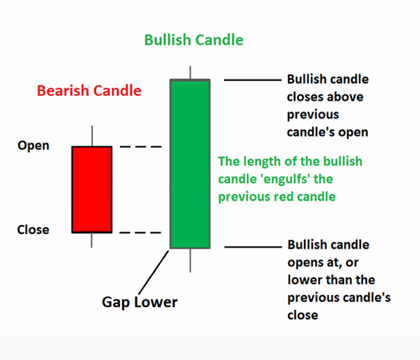
II. CANDLESTICKS: BULLISH CANDLE
A bullish candlestick pattern is a formation on a price chart that signals a potential uptrend or the continuation of an existing upward move. These patterns suggest that buyers are gaining control and that price may rise in the near future.
Each candlestick shows four key data points within a specific time frame: the opening price, closing price, highest price, and lowest price. Bullish patterns often appear at the end of a downtrend or during a pullback in an uptrend, giving traders clues for possible reversal or continuation setups. Common bullish candlestick patterns include the bullish engulfing, hammer, and morning star, all of which reflect strong buying pressure in the market.
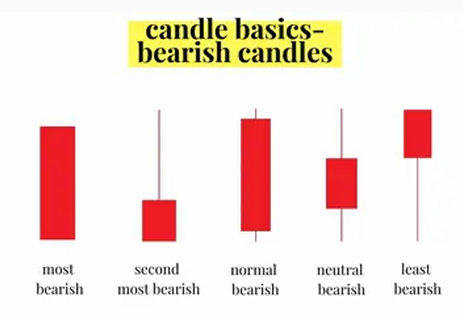
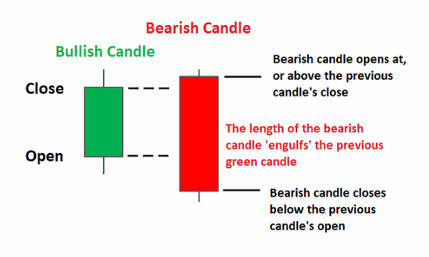
CANDLESTICKS: BEARISH CANDLE
A bearish candlestick is a visual indicator on a price chart that signals a potential downtrend or upcoming decline in price. It reflects selling pressure and a shift in momentum from buyers to sellers.
This candlestick is formed using four key values: the opening price, closing price, high, and low within a given time frame. In most charting platforms, a bearish candle typically appears red or black, showing that the closing price is lower than the opening price.
Bearish candlestick patterns often appear at market tops or after a retracement during a downtrend, helping traders spot potential reversal or continuation setups.
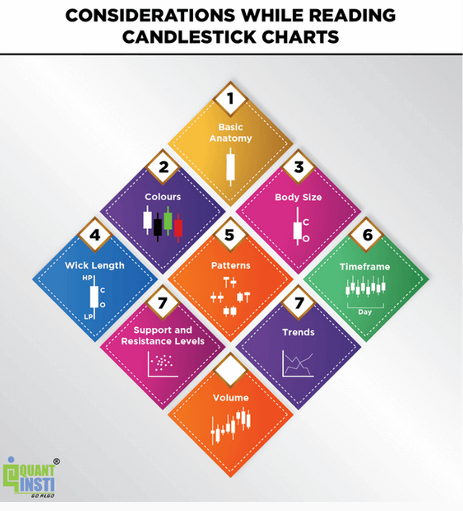
CANDLESTICKS: HOW TO READ?
These are the most important factors I consider before taking a position:
- Price Action (PA) of the coin
- Size of the candle bodies, which shows momentum and strength
- Recognizable patterns like breakouts, rejections, or consolidations
- The timeframe I’m trading on and how it aligns with higher or lower timeframe
III. VOLUME
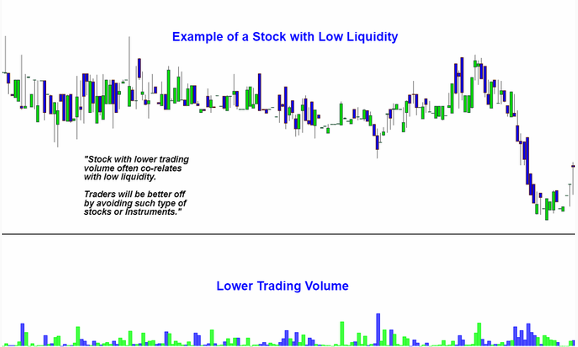
Volume represents the number of trades or contracts exchanged during a given period. A rise in volume often signals increased interest and conviction, which can lead to sharp price movements in either direction.
When volume is low, assets tend to be more volatile and less predictable. This is because lower liquidity means fewer participants, so even small orders can cause larger price swings.
Traders monitor volume to confirm trends, spot potential reversals, and filter out fake breakouts.
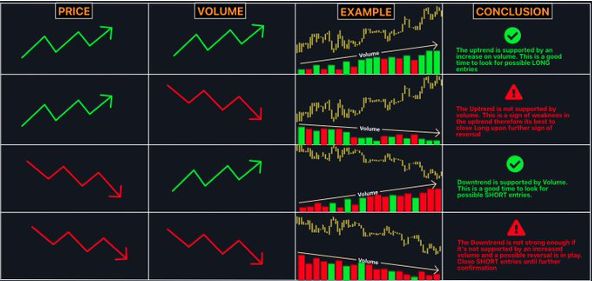
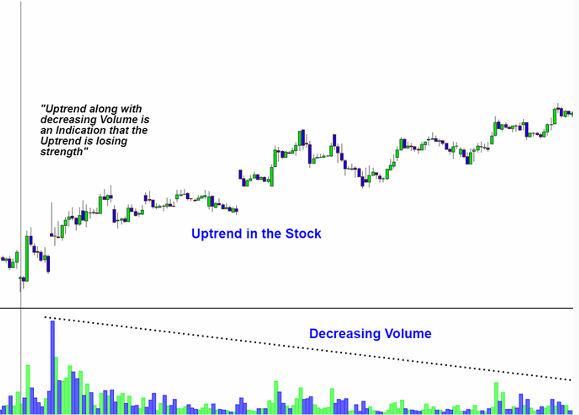
When volume declines while prices rise, it often signals that the uptrend is losing strength, increasing the chances of a reversal. On the other hand, rising prices with increasing volume confirm strong bullish momentum and a healthy uptrend.
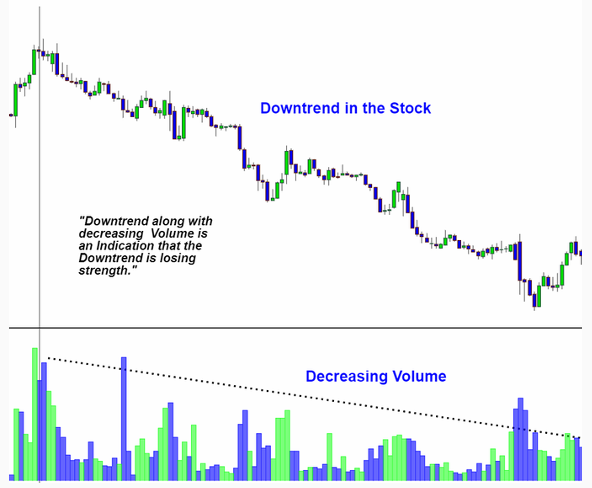
If prices are falling while volume increases, it suggests strong selling pressure and the likelihood of a continued downtrend.
When volume is decreasing while price is also falling, it typically indicates a bearish trend with weakening momentum.
However, if volume stops decreasing and stabilizes while price continues to fall, it can signal a long term bearish outlook, suggesting that sellers remain in control and demand is not returning.
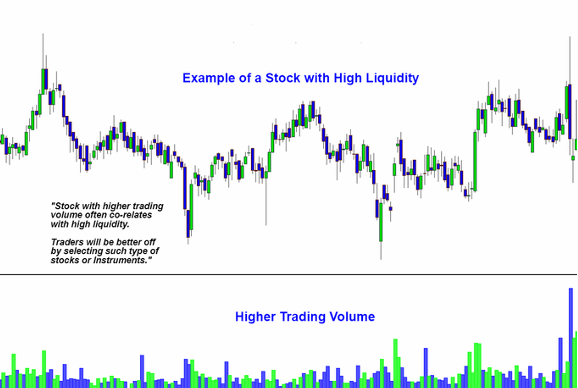
Tokens with high liquidity often show higher trading volumes, meaning they can be bought or sold quickly and with minimal price slippage.
Volume and liquidity are closely linked, both reflecting how active and efficient a market is.
Tokens with higher volume are typically more attractive to traders, as they allow for faster execution and tighter spreads, making them more reliable for strategies.
When a token has low liquidity, it becomes vulnerable to sudden price swings.
Even a single large buy or sell order can cause a significant move, leading to increased volatility and unpredictable price behavior.