


![The Liquidity Edge [MSS, BOS, FVG, ICT, etc.]](https://taquant-content.s3.eu-north-1.amazonaws.com/books/the-liquidity-edge-mss-bos-fvg-ict-etc/1774850010625-Screenshot_30-3-2026_134633_.jpeg)
THE LIQUIDITY EDGE
Written by SoulzBTC
Introduction to Liquidity
What is Liquidity in Trading?
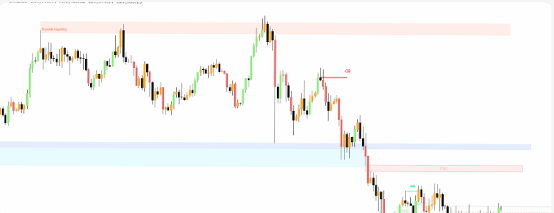
Liquidity is simply orders waiting to be filled. In practice, this means stop losses that cluster at predictable locations. Think about where most traders place their stops:
- Just below swing lows (if they're long)
- Just above swing highs (if they're short)
- At round numbers (psychological levels)
- At equal highs or lows (multiple tests
Why Traditional Indicators Don't Show This Most indicators you're familiar with-moving averages, RSI, MACD-are lagging. They tell you what happened, not what's about to happen.
Smart Money Concepts (SMC) are different. They show you:
- Where institutions have their orders (Order Blocks)
- Where price moved too fast (Fair Value Gaps)
- Where stops are clustered (Liquidity)
- When trends are changing (Market Structure)
The problem? Manually identifying all of these takes forever. You need multiple indicators, constant attention, and even then you might miss setups. That's what I built the Smart Liquidity Indicator to solve. Everything you need to trade like institutions, in one tool
MARKET STRUCTURE (MSS & BOS)
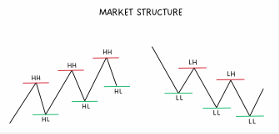
Understanding Market Structure
Market structure is the foundation of everything. Before you enter any trade, you need to answer one question: Is price in an uptrend, downtrend, or ranging?
This sounds simple, but most traders get it wrong. They see a few green candles and call it an uptrend. They see red candles and call it a downtrend. But real market structure is about swing points and how price interacts with them. The Basics of Structure
An uptrend is defined by:
- Higher Highs (HH)
- Higher Lows (HL)
A downtrend is defined by:
- Lower Highs (LH)
- Lower Lows (LL)
Sounds textbook, right? But here's where it gets interesting: breaks in this structure tell you everything.
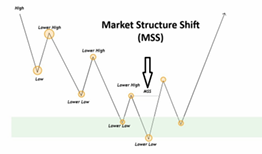
What is MSS (Market Structure Shift)
Market Structure Shift = Trend Change
An MSS occurs when price breaks through a key structural point in the OPPOSITE direction of the current trend. In an Uptrend:
- Price making higher highs and higher lows
- MSS = Price breaks BELOW the most recent significant swing low
- This signals potential trend change from up to down
In a Downtrend:
- Price making lower highs and lower lows
- MSS = Price breaks ABOVE the most recent significant swing high
- This signals potential trend change from down to up
Why MSS Matters for Trading
When you see an MSS, institutions are signaling a shift. They're no longer defending the previous trend. This is your cue to:
-
- Exit trades in the old trend direction
-
- Prepare to enter trades in the new direction
-
- Look for confirmation (Order Blocks, FVGs, liquidity sweeps)
I don't trade MSS blindly. But when MSS aligns with other confluences, it's one of the highest probability setups
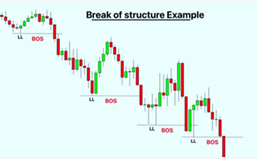
BOS (Break of Structure)
A Break of Structure occurs when price breaks a swing point in the same direction as the current trend. This confirms trend continuation.
In an Uptrend:
-
MSS already confirmed uptrend direction
-
BOS = Price breaks above recent swing highs
-
This confirms the uptrend is still strong
-
Institutions are still buying
In a Downtrend:
- MSS already confirmed downtrend direction
- BOS = Price breaks below recent swing lows
- This confirms the downtrend is still strong
- Institutions are still selling
Again, the Smart Liquidity Indicator marks these automatically with "BOS" labels in a lighter color than MSS
Why BOS Matters for Trading
BOS tells you the trend is healthy and continuing.
When I see a BOS:
-
- I look to enter in the trend direction on pullbacks
-
- I avoid counter-trend trades
-
- I use each BOS level as a new support/resistance
The most powerful trades happen when price pulls back after a BOS, retests a key zone (Order Block or FVG), then continues in the trend direction